Proteomics by mass spectrometry: what is inside a raw file

A technical walkthrough of bottom-up proteomics: sample preparation, LC-MS/MS acquisition, the anatomy of vendor and open raw formats (mzML, mzMLb, imzML), reading data with Python and R, identification and quantification, missing values, and how other proteomics methods compare.
Proteomics
Author

Jie Hua

Published

October 26, 2026

Modified

October 26, 2026

写作说明

本文由 DeepSeek-Flash 生成,尚未经过人工校对,可能存在事实、数字或表述上的错误,请以原始文献、仪器手册和官方文档为准。

文中的所有图表都由本文的 R 代码在渲染时生成,其中的数值是为说明概念而模拟的,不代表任何真实仪器、样本或数据集。软件包名称与文件格式的描述基于公开文档,但版本演进很快,实际使用时请以对应版本的文档为准。

蛋白质组学最容易被误解的一点是:很多人以为”测一个蛋白”就是仪器直接报告一个浓度。实际上,基于质谱的蛋白质组学测的是肽段的质荷比和信号强度,蛋白是从这些肽段反推出来的。所以一个 .raw 文件里并没有”蛋白”这个字段,只有成千上万张质谱图,以及每张图属于哪一次扫描、在什么时间、用什么参数采集。

这篇文章按数据实际流动的顺序展开:

  1. 蛋白质组学要回答什么问题,为什么难;
  2. 一台 LC-MS/MS 里到底发生了什么;
  3. 原始数据里存了哪些字段;
  4. DDA、DIA、PRM 三种采集策略;
  5. 厂商封闭格式与开放格式(mzML 等)的架构差别;
  6. 用 Python 和 R 把数据读进来;
  7. 从谱图到蛋白表:搜库、FDR、蛋白推断、定量、缺失值;
  8. 除了基于质谱的方法,还有哪些蛋白质组学路线,各自能回答什么。

目标是写成一份可以按图索骥的技术报告。

1. 蛋白质组学测的是什么,为什么难

基因组是一份稳定的序列,转录组是”此刻在转录什么”,而蛋白质组是此刻真正在执行功能的分子。三者之间并不是简单的一一映射:

  • 一个基因可以产生多种蛋白质形式(proteoform):可变剪接、蛋白酶切、信号肽去除;
  • 蛋白丰度与 mRNA 丰度只有中等相关(常见报道在 0.4–0.6 之间),因为翻译效率和降解速率不同;
  • 蛋白会被修饰(磷酸化、乙酰化、泛素化、糖基化、氧化),修饰状态往往才是功能开关;
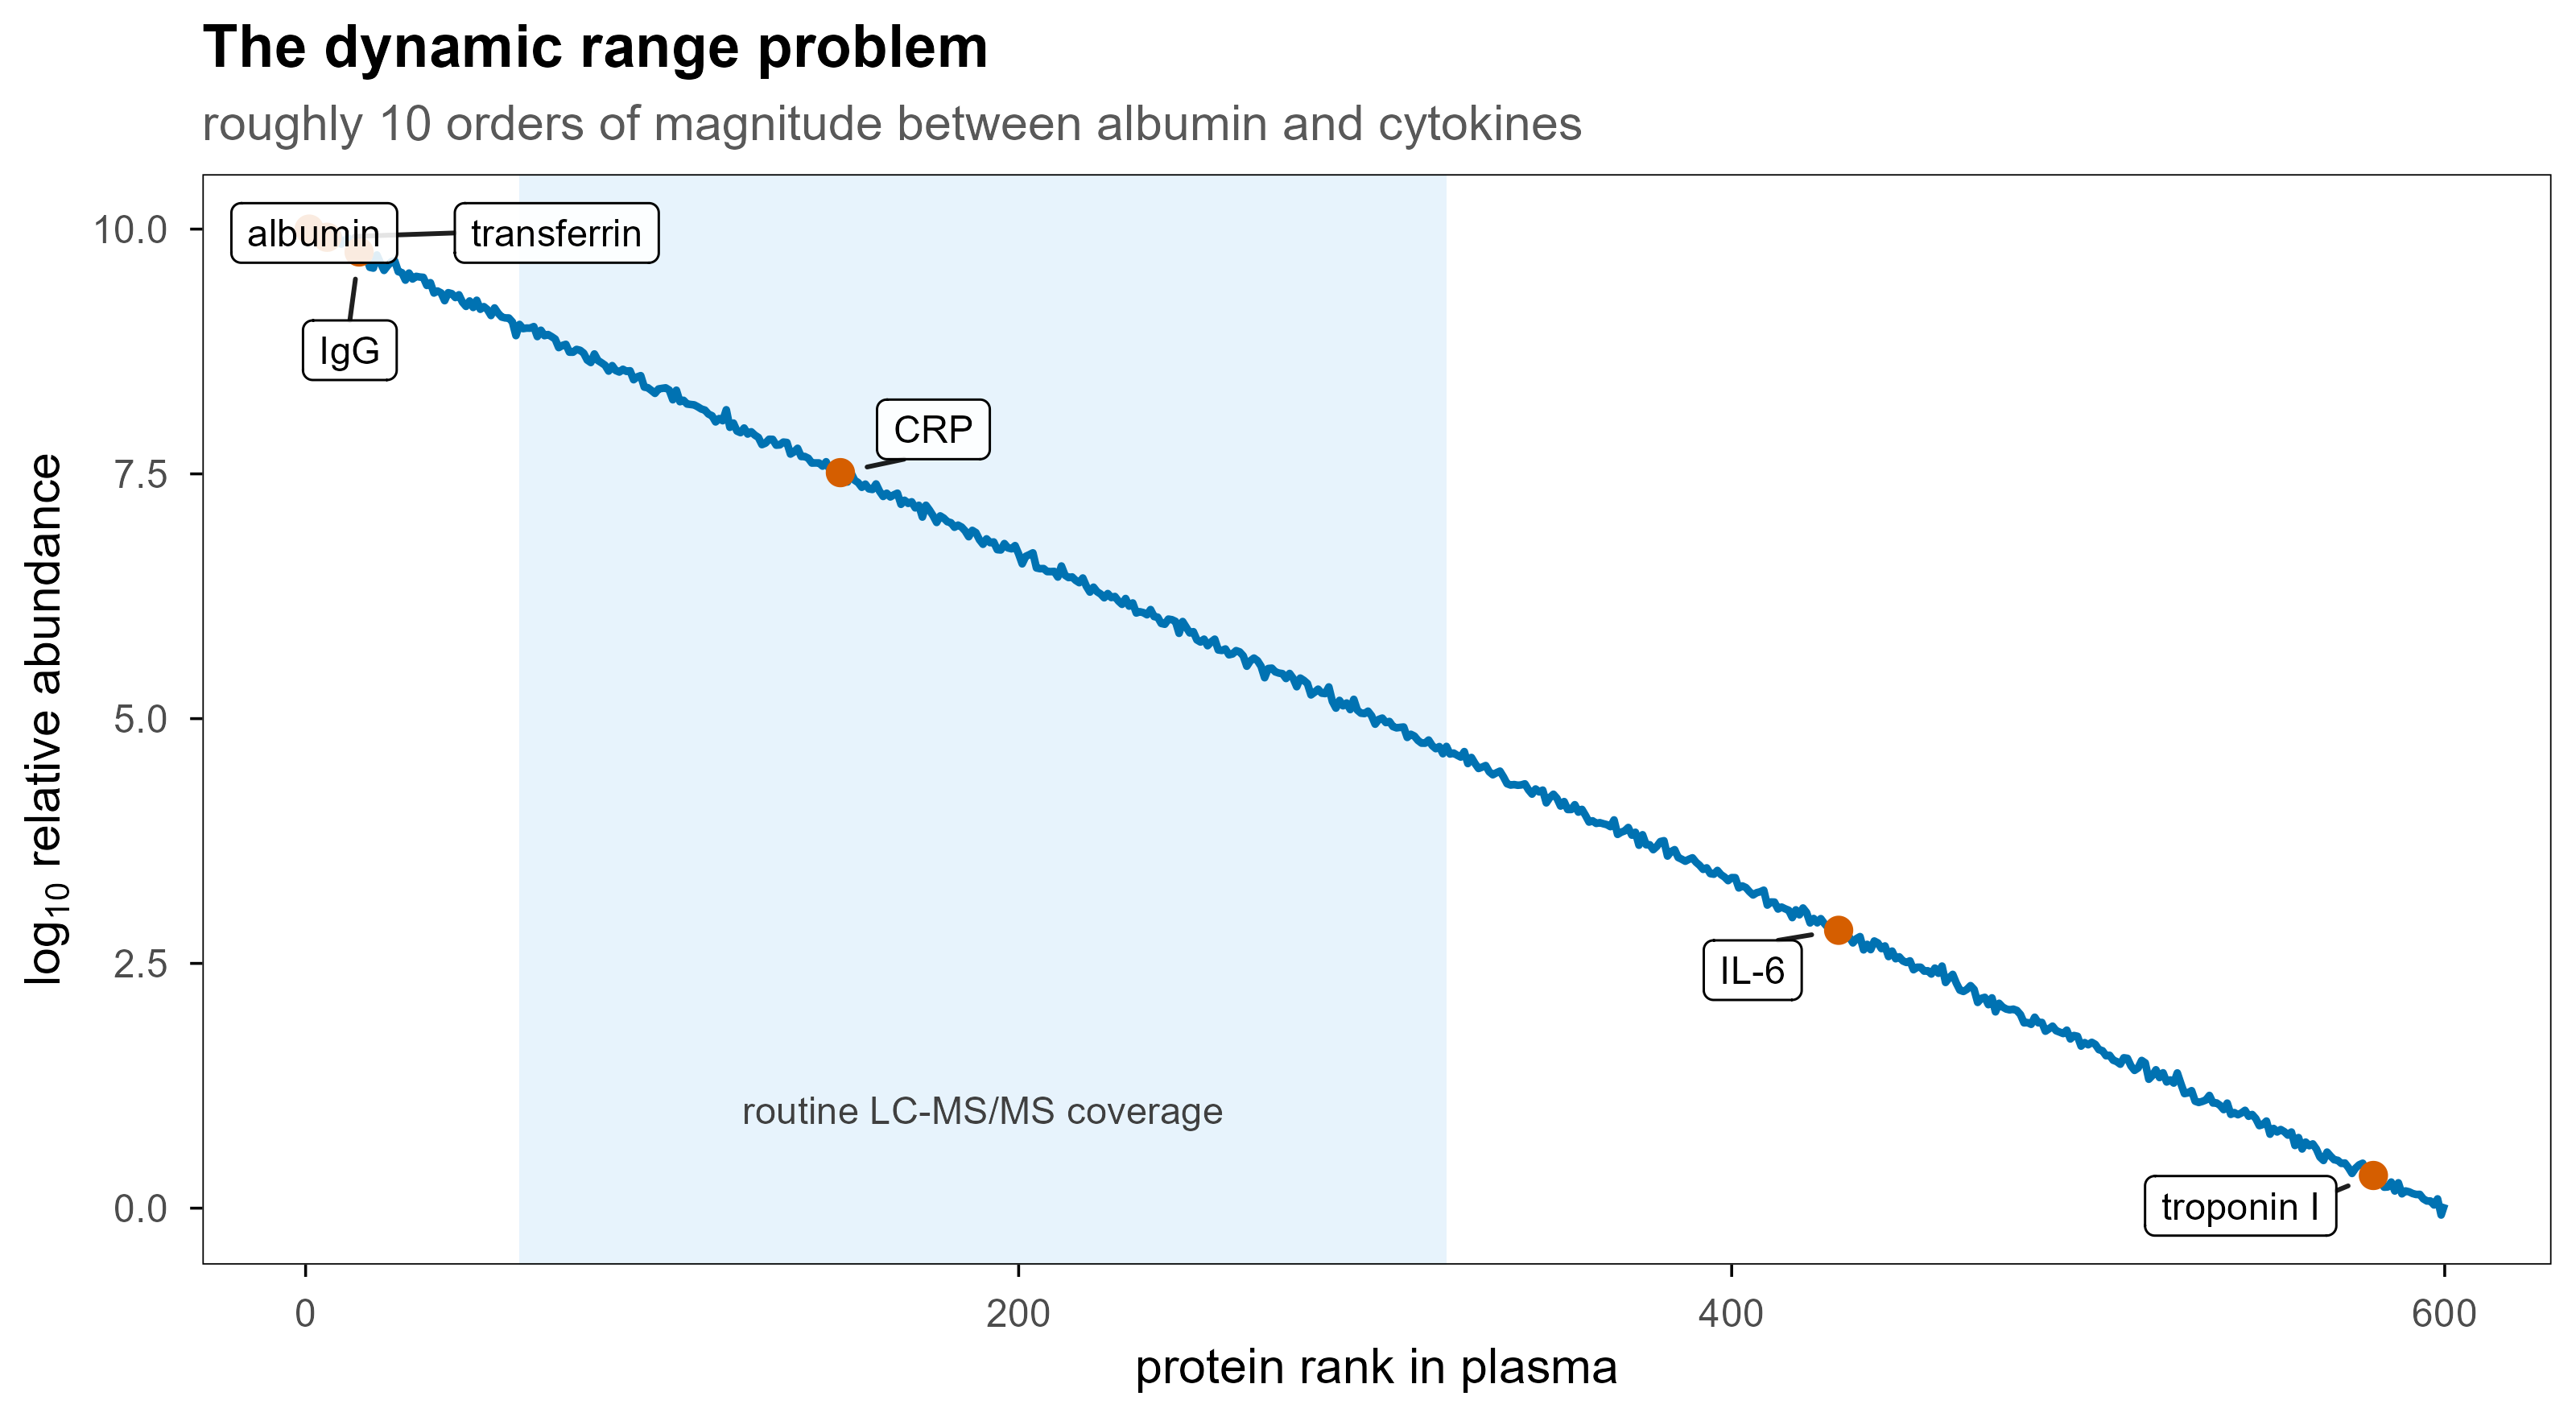
  • 蛋白丰度的动态范围极大:血浆中白蛋白与低丰度细胞因子之间可以相差 10 个数量级。
set.seed(42)
ab <- data.frame(rank = 1:600)
ab$log_ab <- 10 - 10 * (ab$rank - 1) / 599 + rnorm(nrow(ab), 0, 0.04)

mark <- data.frame(
  protein = c("albumin", "transferrin", "IgG", "CRP", "IL-6", "troponin I"),
  rank = c(1, 6, 15, 150, 430, 580)
)
mark$log_ab <- 10 - 10 * (mark$rank - 1) / 599

set.seed(1)
ggplot(ab, aes(rank, log_ab)) +
  annotate("rect", xmin = 60, xmax = 320, ymin = -Inf, ymax = Inf,
           fill = blog_pal[["sky"]], alpha = 0.14) +
  annotate("text", x = 190, y = 1.0, label = "routine LC-MS/MS coverage",
           size = 3, colour = "grey25") +
  geom_line(colour = blog_pal[["blue"]], linewidth = 0.8) +
  geom_point(data = mark, colour = blog_pal[["vermillion"]], size = 2.4) +
  geom_label_repel(
    data = mark, aes(label = protein), size = 3,
    fill = "white", alpha = 0.88, label.size = 0.2,
    min.segment.length = 0, box.padding = 0.45, point.padding = 0.35,
    max.overlaps = Inf
  ) +
  labs(
    x = "protein rank in plasma", y = expression(log[10]~"relative abundance"),
    title = "The dynamic range problem",
    subtitle = "roughly 10 orders of magnitude between albumin and cytokines"
  )
Figure 1: 血浆蛋白的丰度横跨约 10 个数量级。质谱一次进样能覆盖的主要是中间那一段,最两端通常需要去除高丰度蛋白或富集低丰度蛋白。

把这件事翻译成数据语言,就是三个不同层次的问题:

层次 问题 数据产物
鉴定(identification) 样本里有哪些肽段和蛋白 PSM 表、peptide 表、protein 表
定量(quantification) 每个蛋白在不同样本里有多少 强度矩阵、比值、差异检验结果
状态(state) 修饰位点、互作、定位、结构 位点表、互作网络、交联对、HDX 曲线

后面所有的文件格式和分析步骤,都是为这三层服务。

2. 一台 LC-MS/MS 里发生了什么

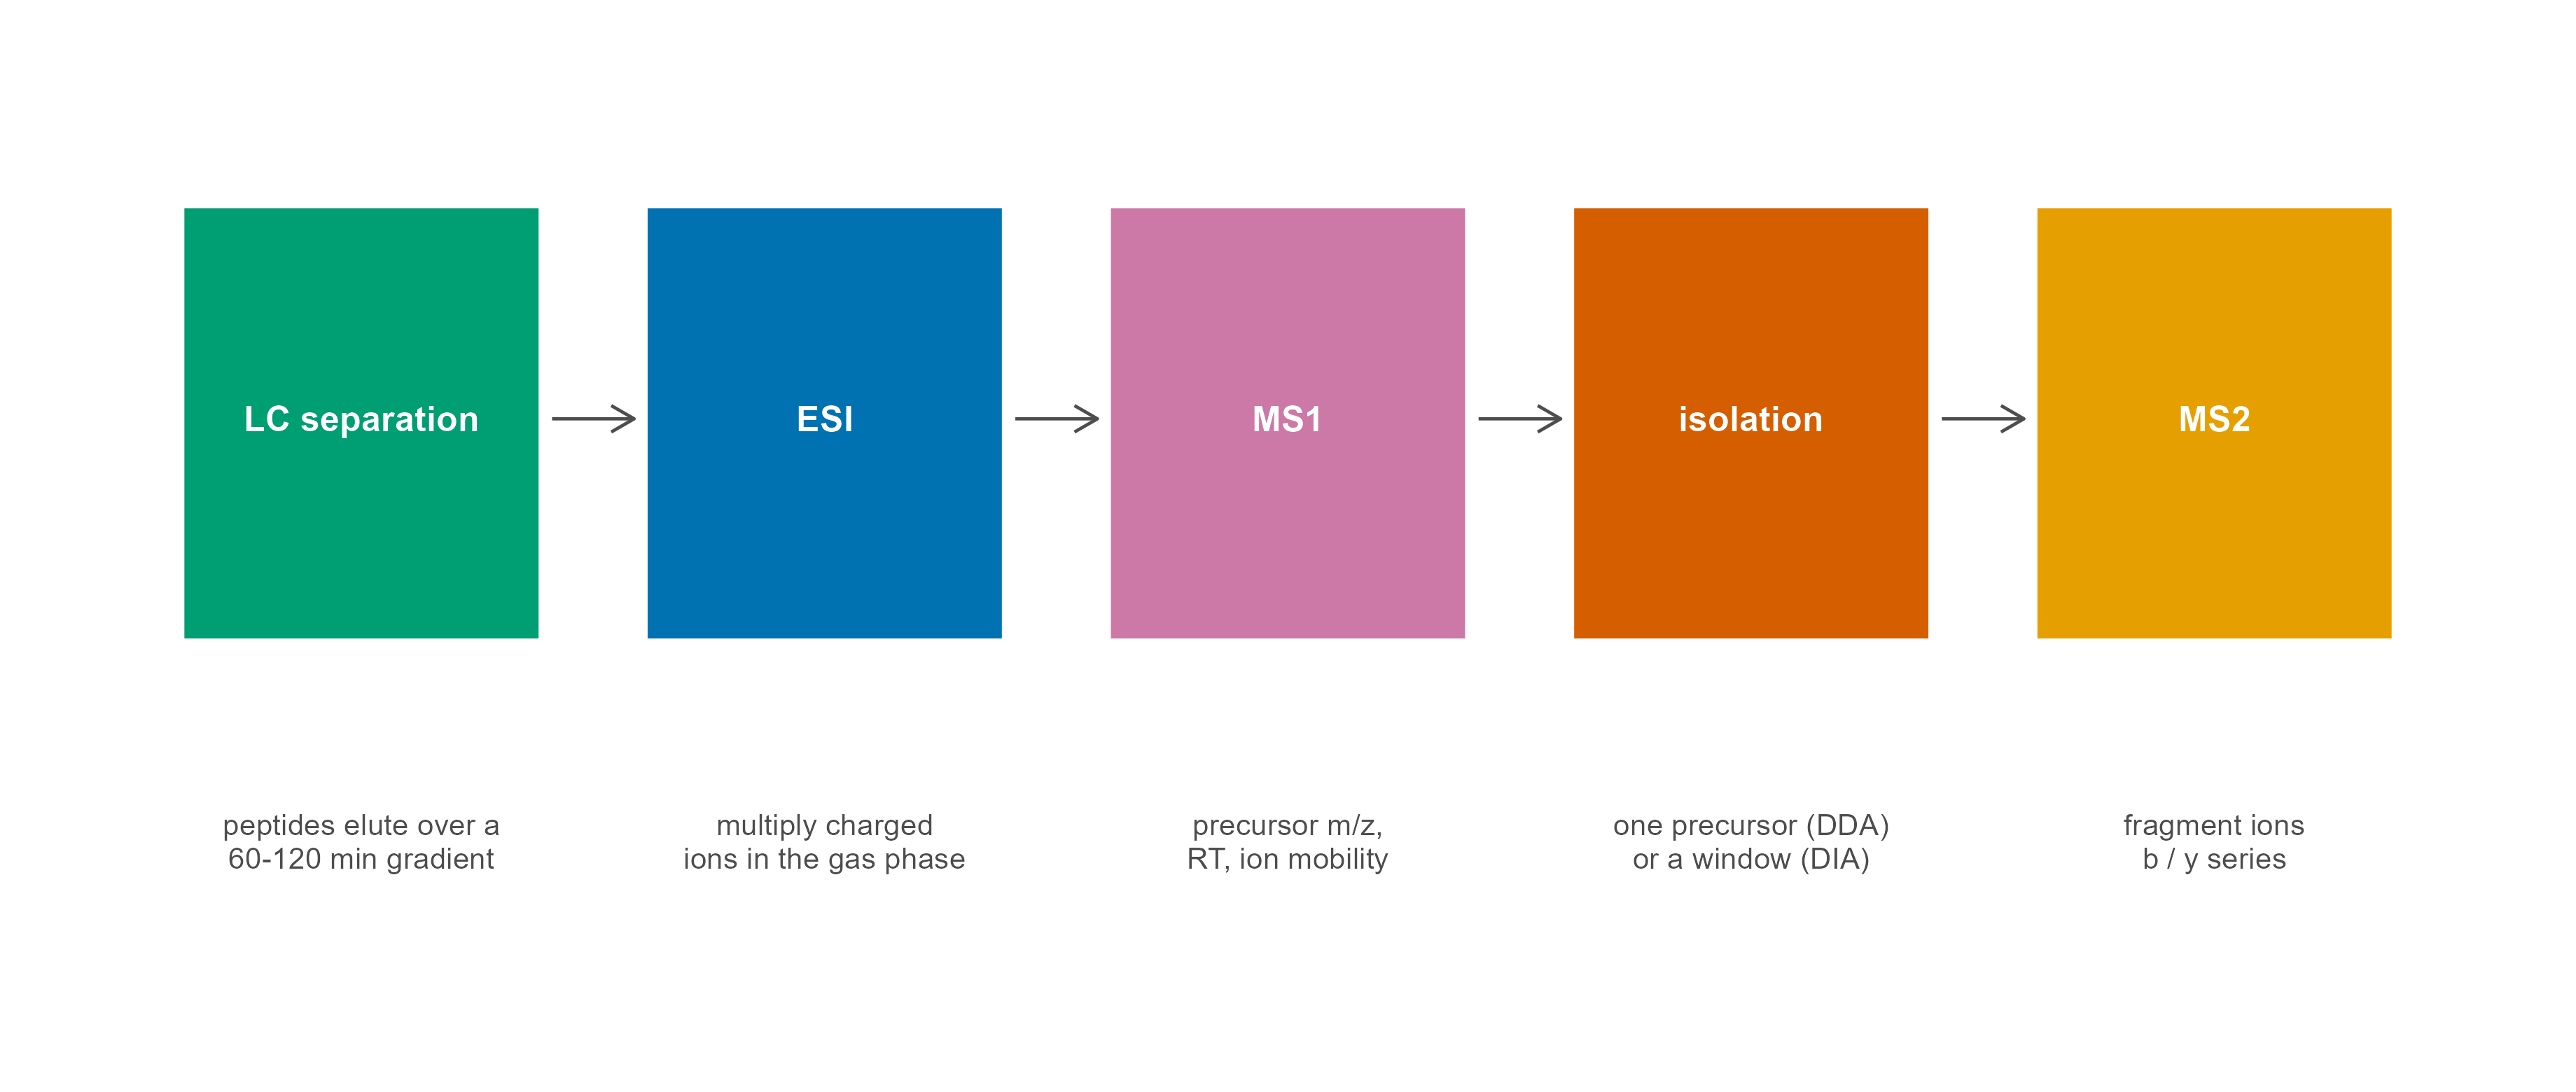
自下而上(bottom-up)蛋白质组学的标准流程是:提取蛋白 → 酶切成肽段 → 液相色谱分离 → 电喷雾离子化 → 质谱测量 → 数据库搜索。之所以先酶切,是因为完整蛋白太大、太难气化和碎裂;胰蛋白酶(trypsin)在 Lys/Arg 之后切割,产生长度和带电性质都比较适合质谱的肽段(常见 7–25 个氨基酸)。

steps <- data.frame(
  x = c(1, 2.75, 4.5, 6.25, 8),
  head = c("LC separation", "ESI", "MS1", "isolation", "MS2"),
  sub = c(
    "peptides elute over a\n60-120 min gradient",
    "multiply charged\nions in the gas phase",
    "precursor m/z,\nRT, ion mobility",
    "one precursor (DDA)\nor a window (DIA)",
    "fragment ions\nb / y series"
  )
)
links <- data.frame(x = steps$x[-nrow(steps)] + 0.72, xend = steps$x[-1] - 0.72)

ggplot() +
  geom_rect(
    data = steps,
    aes(xmin = x - 0.68, xmax = x + 0.68, ymin = 0.42, ymax = 0.90, fill = head),
    colour = "white", linewidth = 0.7
  ) +
  geom_text(data = steps, aes(x, 0.665, label = head),
            colour = "white", fontface = "bold", size = 3.2) +
  geom_text(data = steps, aes(x, 0.20, label = sub),
            size = 2.7, colour = "grey30", lineheight = 0.95) +
  geom_segment(
    data = links, aes(x = x, xend = xend, y = 0.665, yend = 0.665),
    arrow = arrow(length = unit(2.4, "mm")), colour = "grey30", linewidth = 0.4
  ) +
  scale_fill_manual(values = pal[1:5], guide = "none") +
  coord_cartesian(xlim = c(0.15, 8.85), ylim = c(0, 1.05), clip = "off") +
  theme_blog() +
  theme(
    axis.text = element_blank(), axis.title = element_blank(),
    axis.ticks = element_blank(), panel.border = element_blank(),
    legend.position = "none"
  )
Figure 2: 自下而上蛋白质组学的主链路。每一步的产物都是一个可检查的中间文件,这也是排错时最有效的定位顺序。

几个决定数据形态的物理事实:

  • 电喷雾(ESI)让肽段带上多个质子,所以同一个肽段会以 2+、3+、4+ 等多个电荷态出现,质荷比不同,但”质量”相同。
  • 质量分析器决定分辨率、质量精度和扫描速度。Orbitrap 分辨率高、质量精度好;TOF 扫描快;离子阱便宜;四极杆常作为前级过滤或做 PRM。这些硬件差别直接决定了 mzML 里每条 scan 的元数据。
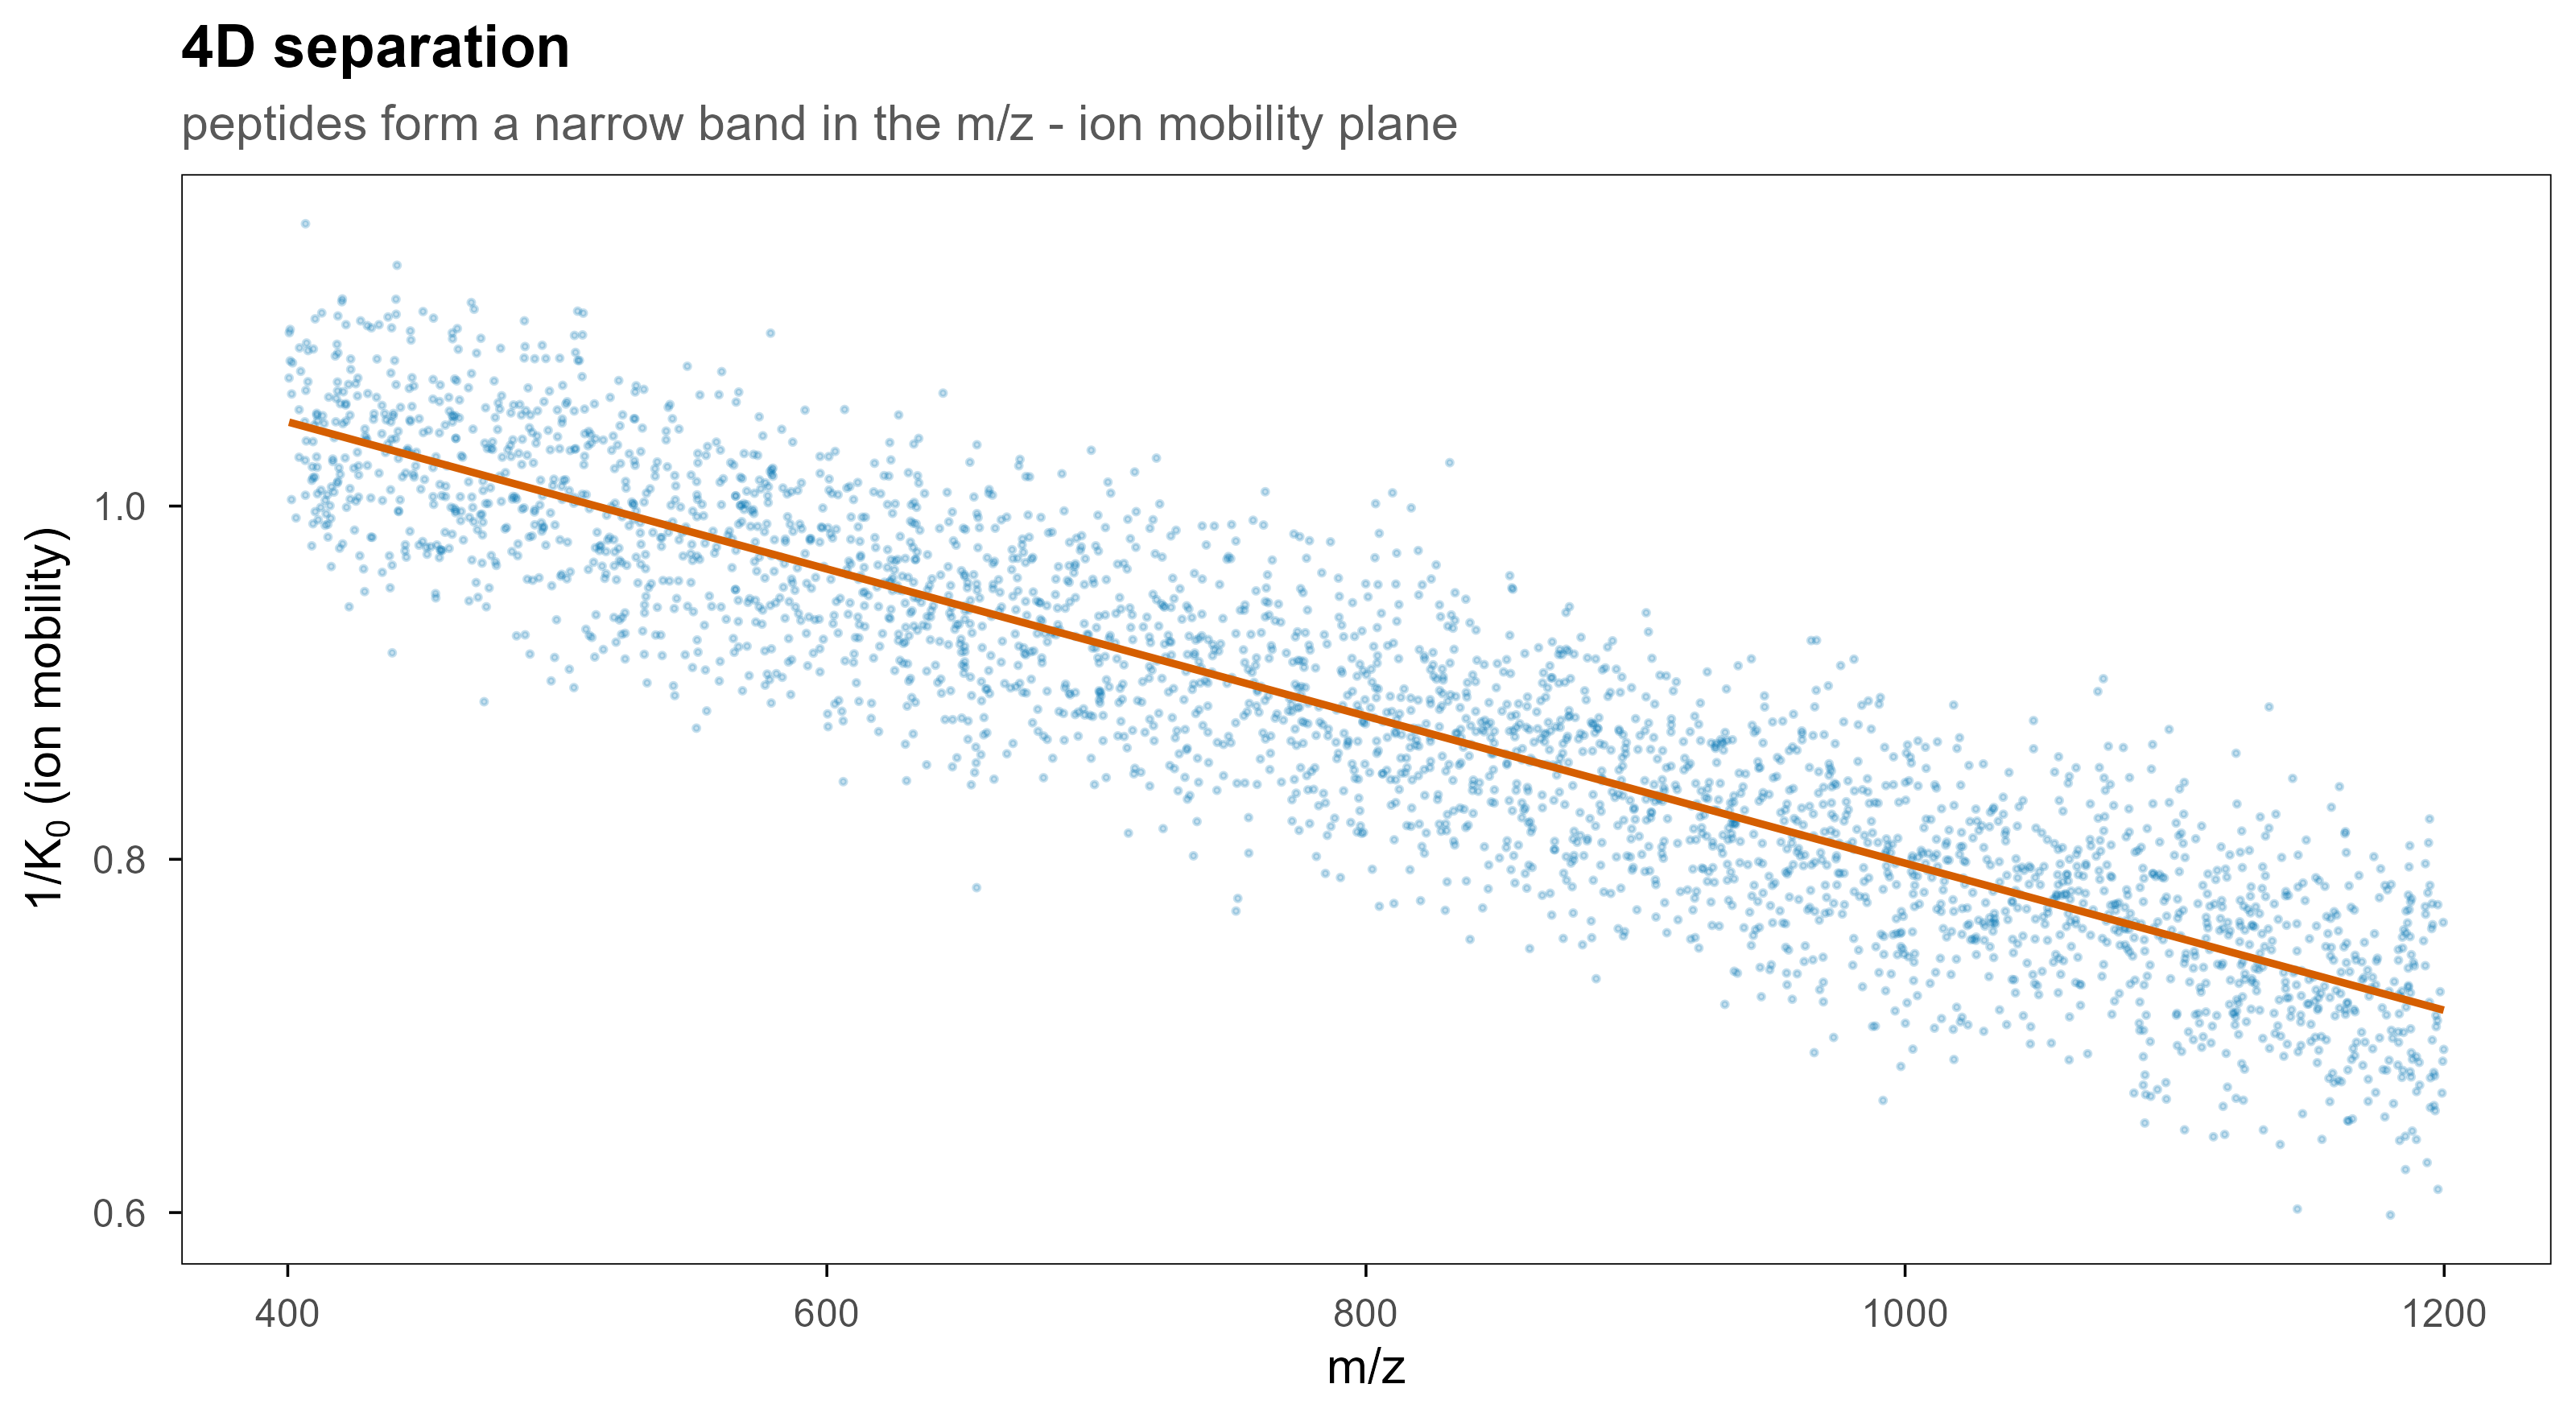
  • 离子淌度(ion mobility)在 m/z 和强度之外再加一维:碰撞截面积(CCS)或 1/K0。timsTOF 的 .d 文件因此是 4D 的。
  • 碎裂方式决定谱图长什么样:HCD/CID 主要产生 b/y 离子,ETD 对磷酸化和大肽段更友好。
set.seed(3)
n <- 3000
mz <- runif(n, 400, 1200)
k0 <- 1.05 - 0.00042 * (mz - 400) + rnorm(n, 0, 0.045)
ccs_df <- data.frame(mz = mz, k0 = k0)

ggplot(ccs_df, aes(mz, k0)) +
  geom_point(colour = blog_pal[["blue"]], size = 0.35, alpha = 0.22) +
  geom_smooth(method = "lm", formula = y ~ x, colour = blog_pal[["vermillion"]],
              linewidth = 0.8, se = FALSE) +
  labs(
    x = "m/z", y = expression("1/"*K[0]~"(ion mobility)"),
    title = "4D separation",
    subtitle = "peptides form a narrow band in the m/z - ion mobility plane"
  )
Figure 3: 加上离子淌度后,数据从 3D 变成 4D。同一 m/z 上的共洗脱肽段可以在淌度维度被分开,这也是 timsTOF 和 FAIMS 提高鉴定数的核心原因。

3. 一次运行在文件里长什么样

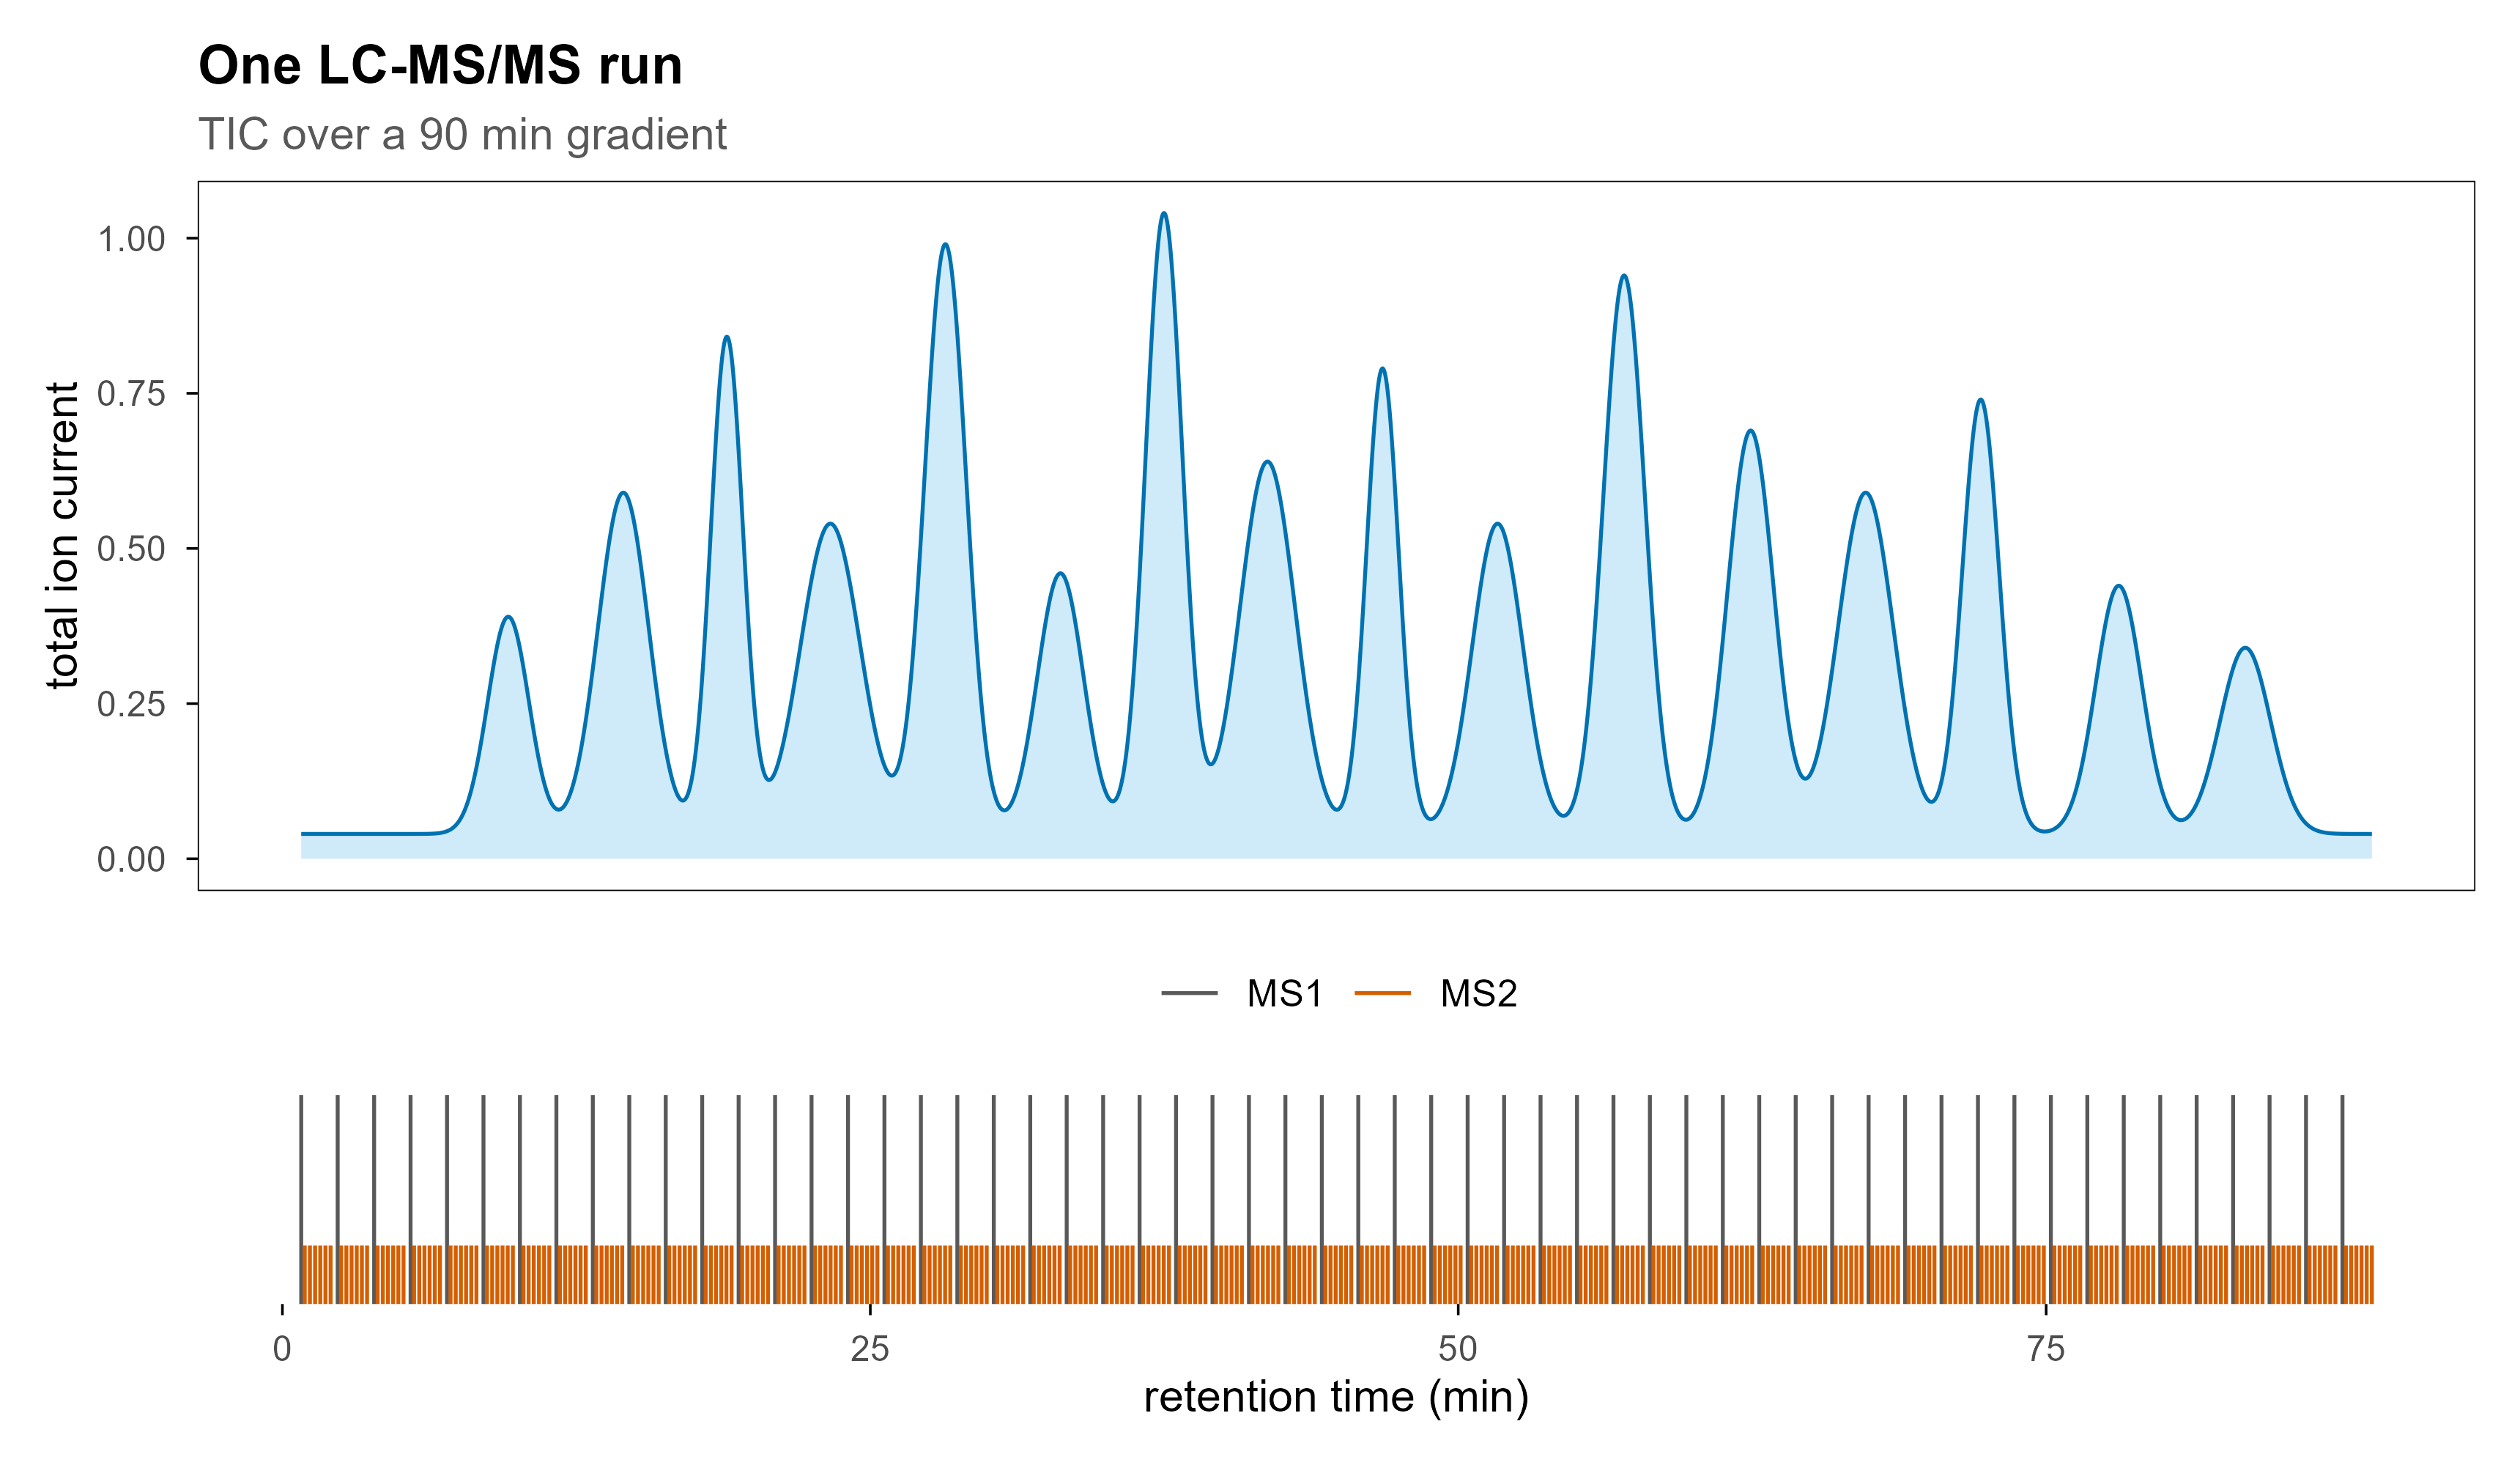
一次 90 分钟的 DDA 运行,典型会产生 3,000–10,000 张 MS1 谱和 30,000–150,000 张 MS2 谱,文件大小从几百 MB 到几 GB。这个规模决定了三件事:不能一次全读进内存、必须能随机访问某一条扫描、必须有索引。

最直观的视图是总离子流(TIC):把每一张 MS1 谱的所有强度加起来,对保留时间作图。

rt <- seq(0, 90, length.out = 4000)
mu  <- c(9, 14, 18.5, 23, 28, 33, 37.5, 42, 47, 52, 57.5, 63, 68, 73, 79, 84.5)
amp <- c(0.35, 0.55, 0.80, 0.50, 0.95, 0.42, 1.00, 0.60, 0.75, 0.50, 0.90, 0.65, 0.55, 0.70, 0.40, 0.30)
wd  <- c(0.90, 1.10, 0.70, 1.30, 0.90, 1.00, 0.80, 1.20, 0.70, 1.10, 0.90, 1.00, 1.20, 0.80, 1.00, 1.10)

tic <- rowSums(sapply(seq_along(mu), function(i) amp[i] * exp(-((rt - mu[i])^2) / (2 * wd[i]^2))))
tic_df <- data.frame(rt = rt, intensity = tic + 0.04)

p_tic <- ggplot(tic_df, aes(rt, intensity)) +
  geom_area(fill = blog_pal[["sky"]], alpha = 0.28) +
  geom_line(colour = blog_pal[["blue"]], linewidth = 0.45) +
  labs(
    x = NULL, y = "total ion current",
    title = "One LC-MS/MS run",
    subtitle = "TIC over a 90 min gradient"
  ) +
  theme(axis.text.x = element_blank(), axis.ticks.x = element_blank())

cyc <- seq(0.8, 89, by = 1.55)
scan_df <- bind_rows(
  data.frame(t = cyc, level = "MS1", h = 1),
  data.frame(t = as.vector(outer(cyc, seq(0.15, 1.25, length.out = 6), "+")),
             level = "MS2", h = 0.28)
)

p_scan <- ggplot(scan_df, aes(x = t, xend = t, y = 0, yend = h, colour = level)) +
  geom_segment(linewidth = 0.45) +
  scale_colour_manual(values = c(MS1 = "grey35", MS2 = blog_pal[["vermillion"]])) +
  scale_y_continuous(expand = c(0, 0)) +
  labs(x = "retention time (min)", y = NULL, colour = NULL) +
  theme(
    axis.text.y = element_blank(), axis.ticks.y = element_blank(),
    legend.position = "top", panel.border = element_blank()
  )

p_tic / p_scan + plot_layout(heights = c(3.4, 1))
Figure 4: 上:总离子流色谱图,峰是随梯度洗脱出来的肽段群体。下:同一条时间轴上的扫描类型,灰色是 MS1 调查扫描,红色是随后触发的 MS2 碎裂扫描。

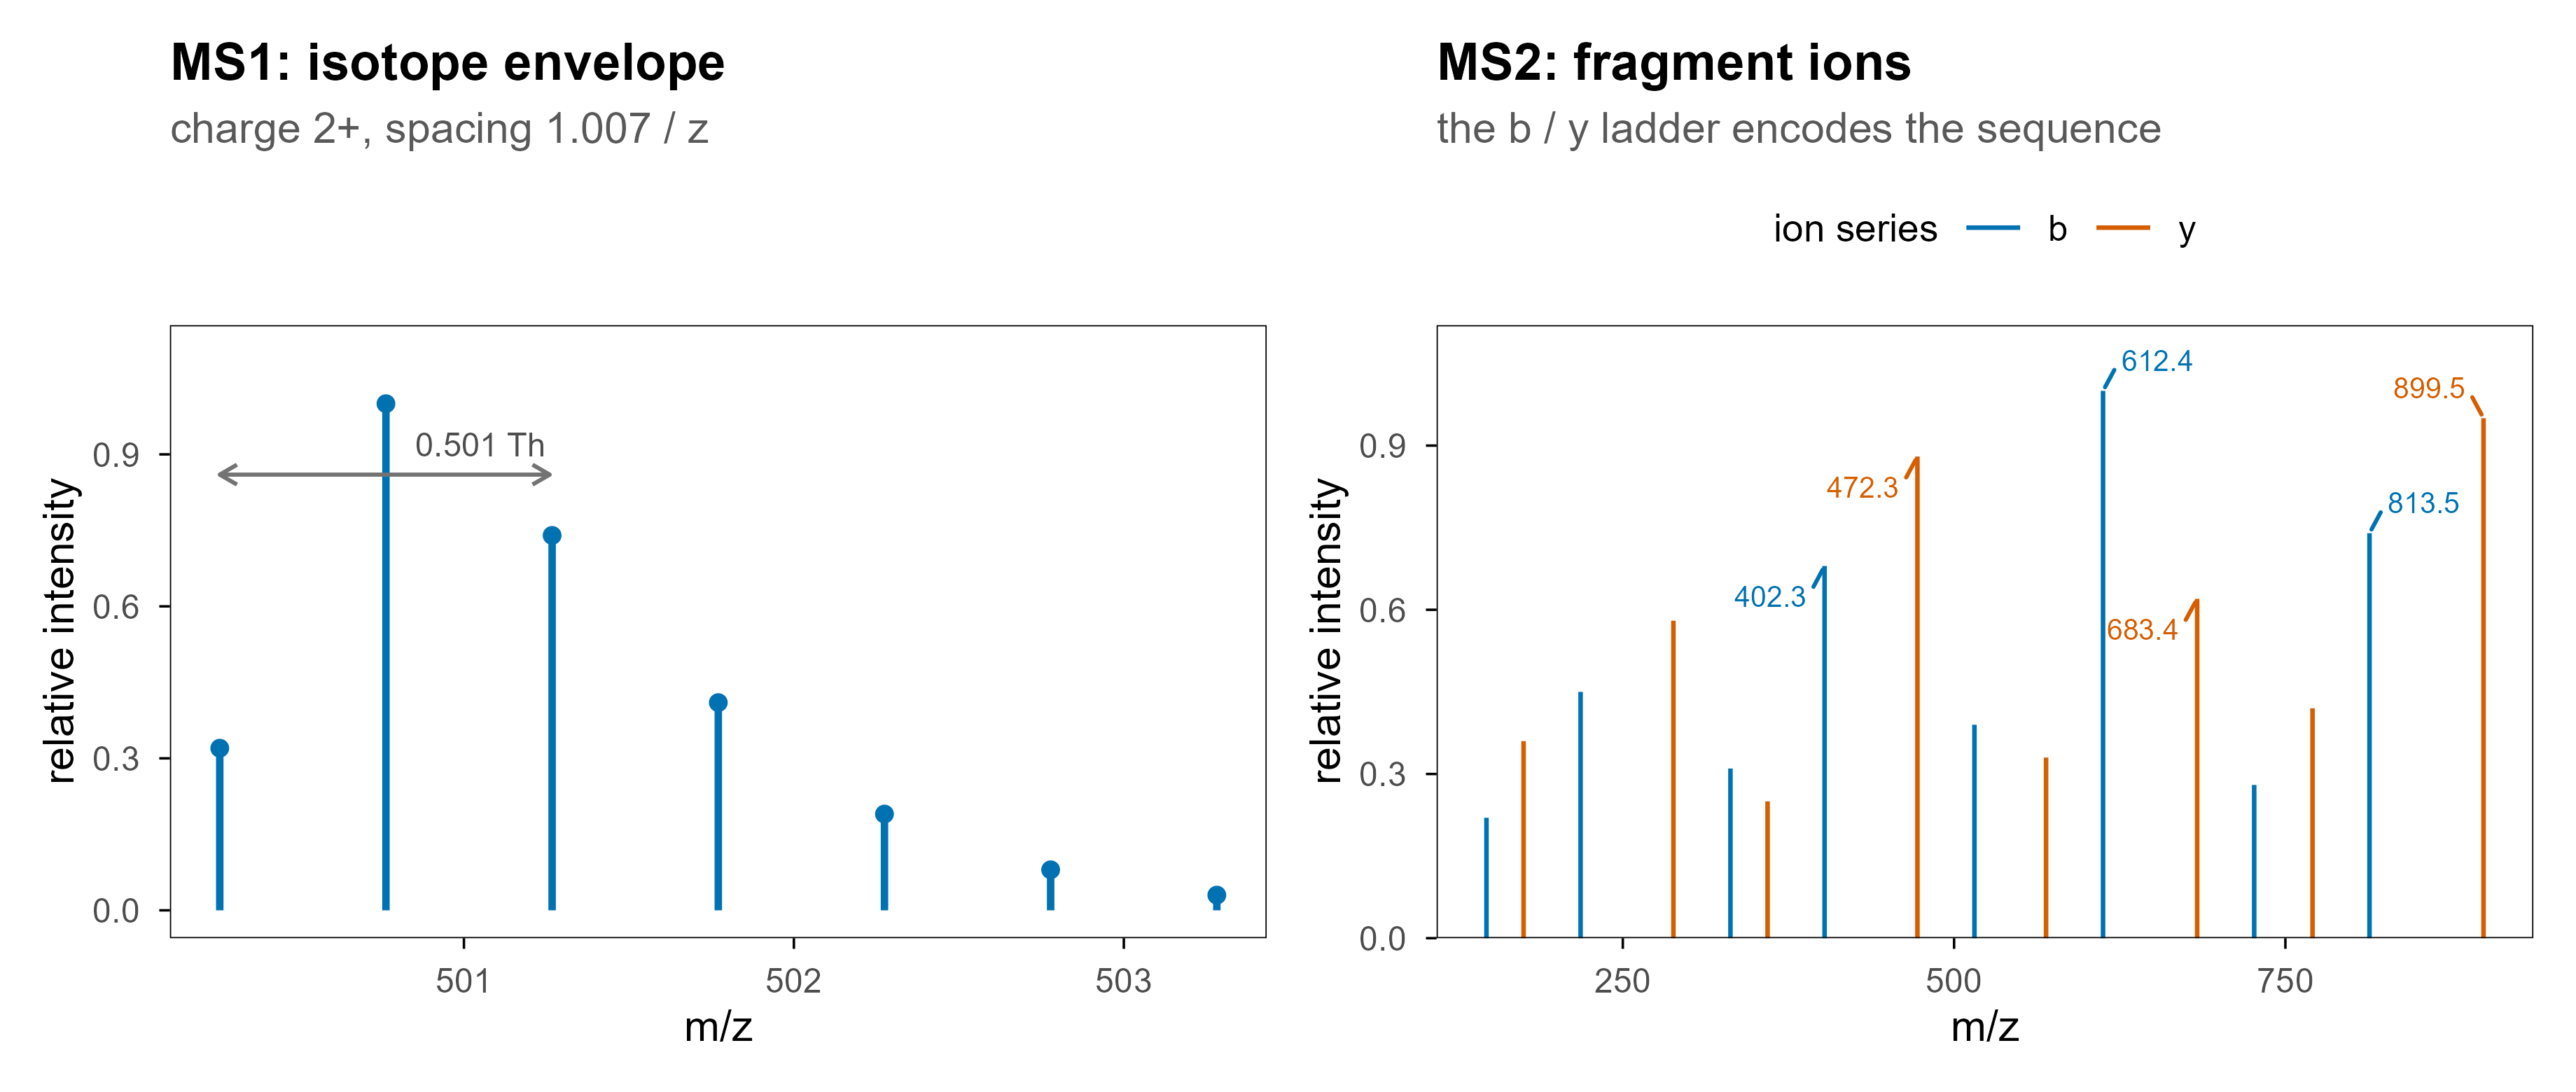
单张谱图则是另一个视图:横轴 m/z,纵轴强度。MS1 上看到的是同位素包络(isotope envelope),MS2 上看到的是碎片离子。

iso <- data.frame(
  mz = 500.26 + (0:6) * (1.00728 / 2),
  intensity = c(0.32, 1.00, 0.74, 0.41, 0.19, 0.08, 0.03)
)
p_ms1 <- ggplot(iso, aes(mz, intensity)) +
  geom_segment(aes(xend = mz, y = 0, yend = intensity),
               colour = blog_pal[["blue"]], linewidth = 0.9) +
  geom_point(colour = blog_pal[["blue"]], size = 1.6) +
  annotate("text", x = 501.05, y = 0.92, label = "0.501 Th", size = 3, colour = "grey30") +
  annotate("segment", x = 500.26, xend = 501.26, y = 0.86, yend = 0.86,
           arrow = arrow(ends = "both", length = unit(1.8, "mm")), colour = "grey45") +
  labs(x = "m/z", y = "relative intensity", title = "MS1: isotope envelope",
       subtitle = "charge 2+, spacing 1.007 / z") +
  ylim(0, 1.1)

frag <- data.frame(
  mz = c(147.11, 218.15, 331.23, 402.27, 515.35, 612.41, 726.45, 813.48,
         175.12, 288.20, 359.25, 472.33, 569.39, 683.43, 770.47, 899.51),
  intensity = c(0.22, 0.45, 0.31, 0.68, 0.39, 1.00, 0.28, 0.74,
                0.36, 0.58, 0.25, 0.88, 0.33, 0.62, 0.42, 0.95),
  series = c(rep("b", 8), rep("y", 8))
)
lab <- frag %>% filter(intensity > 0.6)

p_ms2 <- ggplot(frag, aes(mz, intensity, colour = series)) +
  geom_segment(aes(xend = mz, y = 0, yend = intensity), linewidth = 0.55) +
  geom_text_repel(
    data = lab, aes(label = sprintf("%.1f", mz)), size = 2.6,
    min.segment.length = 0, box.padding = 0.3, seed = 2,
    max.overlaps = Inf, show.legend = FALSE
  ) +
  scale_colour_manual(values = c(b = blog_pal[["blue"]], y = blog_pal[["vermillion"]])) +
  scale_y_continuous(expand = expansion(mult = c(0, 0.12))) +
  labs(x = "m/z", y = "relative intensity", colour = "ion series",
       title = "MS2: fragment ions", subtitle = "the b / y ladder encodes the sequence") +
  theme(legend.position = "top")

p_ms1 | p_ms2
Figure 5: 左:一个 2+ 肽段在 MS1 上的同位素包络,相邻峰间隔约 0.5 Th,由此可以读出电荷态。右:同一条肽段在 MS2 上的碎片离子,b 与 y 系列拼起来就是序列。

4. DDA、DIA、PRM:三种采集策略

数据长什么样,首先取决于仪器怎么选前体。

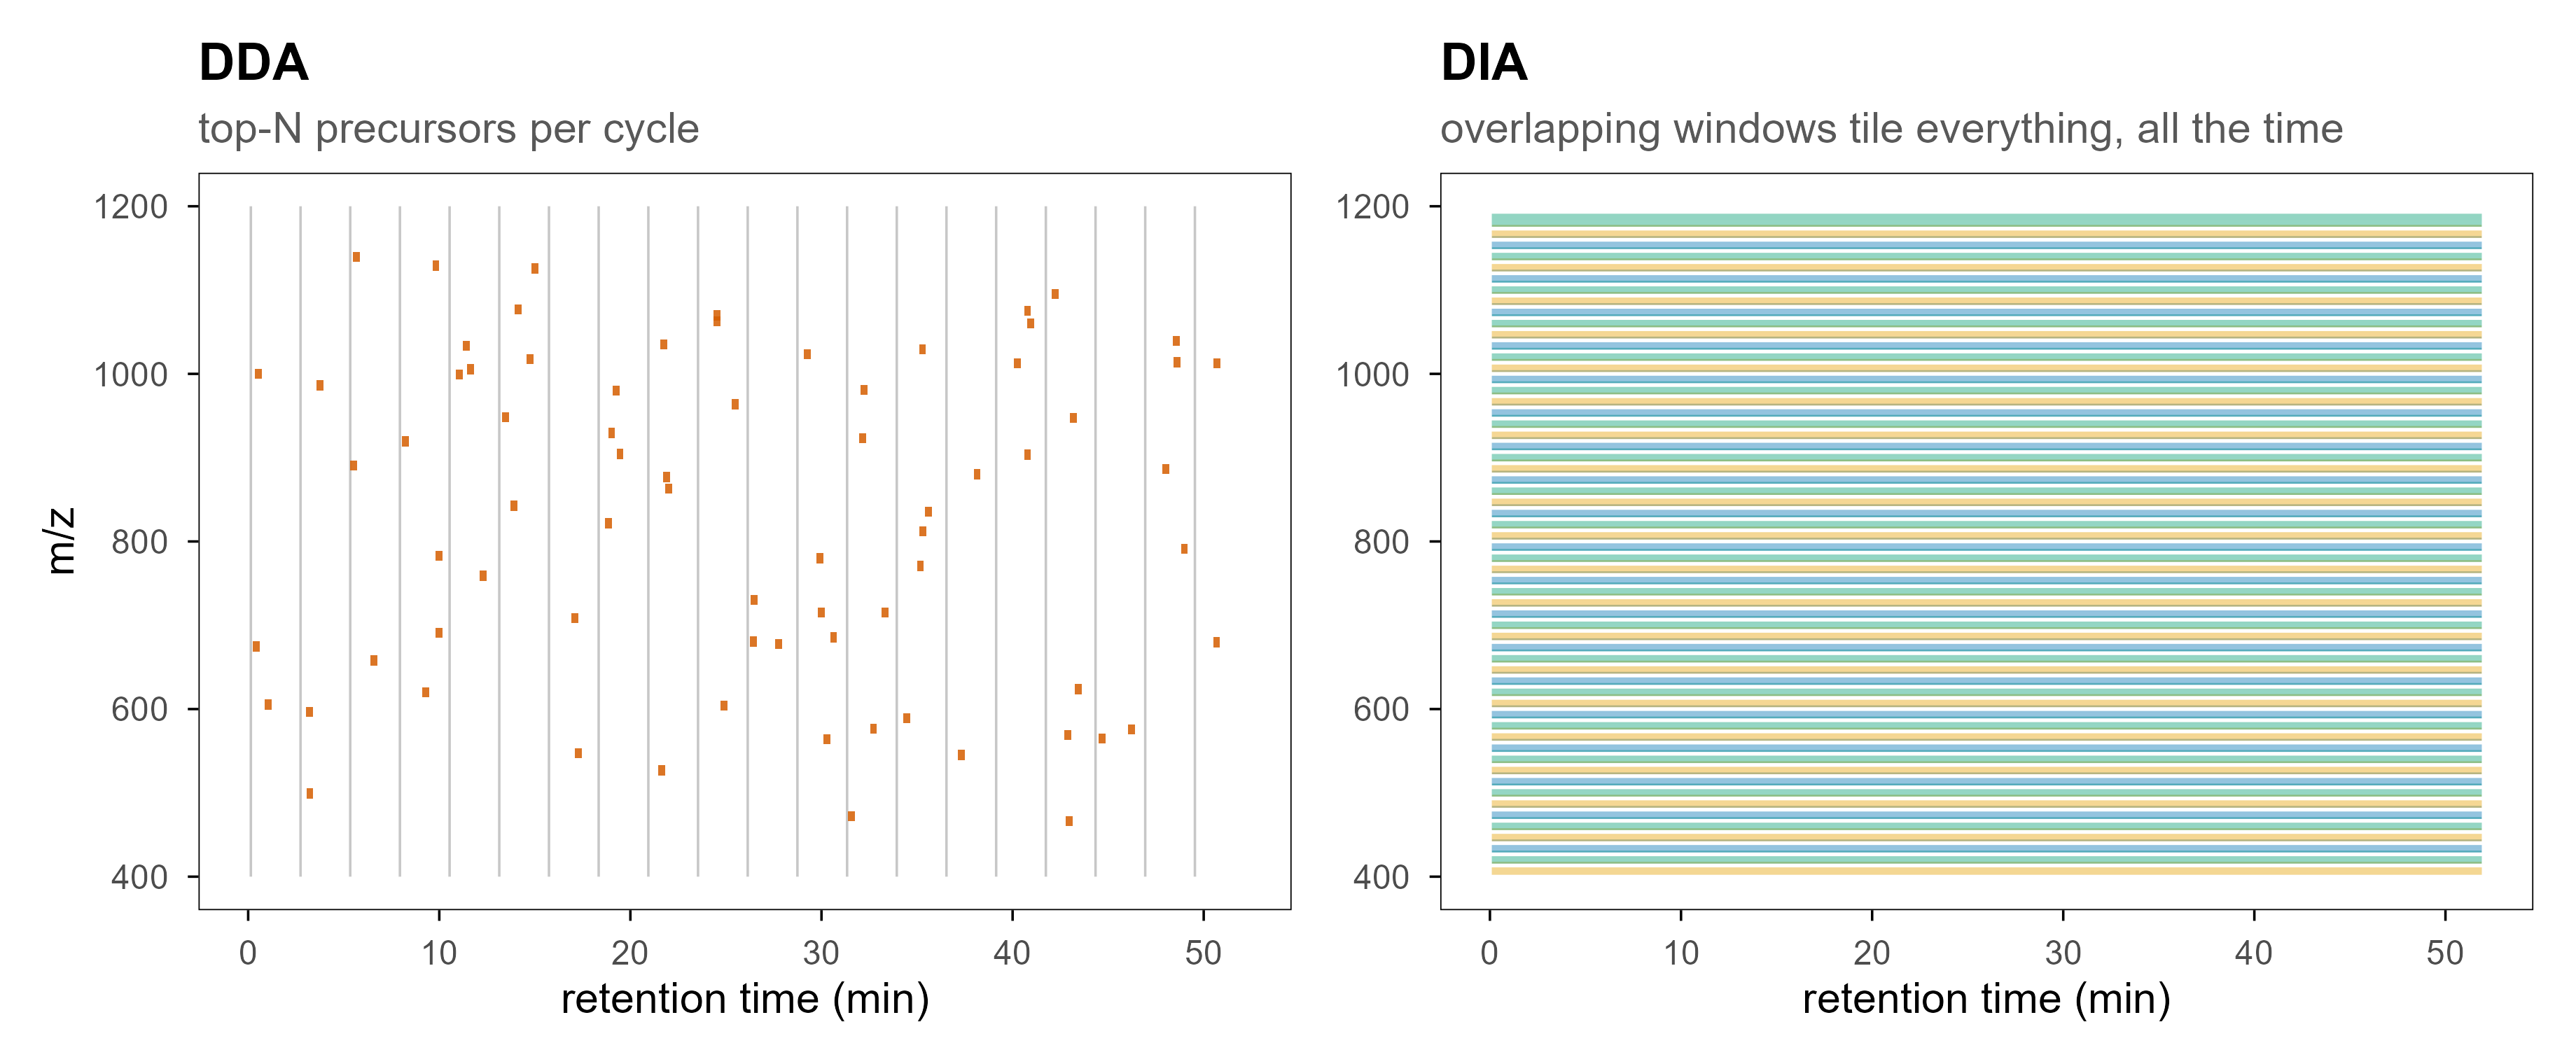
DDA(data-dependent acquisition):先做一张 MS1 调查扫描,挑信号最强的前 N 个前体,逐个隔离、碎裂、采集 MS2。优点是谱图干净、好搜库;缺点是随机性——强弱共洗脱时弱信号会被挤掉,低丰度肽段在不同重复之间可能时有时无,这就是定量缺失值的主要来源之一。

DIA(data-independent acquisition):不等选择,按 m/z 切成若干窗口,每个窗口内的所有前体一起碎裂、一起采集。覆盖更稳定、重复性更好;代价是 MS2 谱是混合谱,必须靠谱图库或伪谱库去卷积。

PRM(parallel reaction monitoring):事先指定目标肽段,把它们的前体列进包含列表,长时间累积信号。这是靶向定量,灵敏度最高,但只能测你列出来的东西。

set.seed(7)
cycles <- 20
ms2 <- do.call(rbind, lapply(seq_len(cycles), function(i) {
  k <- sample(2:5, 1)
  data.frame(
    rt = (i - 1) * 2.6 + runif(k, 0.3, 2.2),
    mz = runif(k, 430, 1150)
  )
}))

p_dda <- ggplot() +
  geom_segment(
    data = data.frame(rt = (seq_len(cycles) - 1) * 2.6 + 0.14),
    aes(x = rt, xend = rt, y = 400, yend = 1200),
    colour = "grey78", linewidth = 0.3
  ) +
  geom_rect(
    data = ms2,
    aes(xmin = rt - 0.18, xmax = rt + 0.18, ymin = mz - 6, ymax = mz + 6),
    fill = blog_pal[["vermillion"]], alpha = 0.85
  ) +
  coord_cartesian(xlim = c(0, 52), ylim = c(400, 1200)) +
  labs(x = "retention time (min)", y = "m/z", title = "DDA",
       subtitle = "top-N precursors per cycle") +
  theme(legend.position = "none")

w <- 20
starts <- seq(400, 1200 - w, by = w * 2 / 3)
dia <- data.frame(ymin = starts, ymax = starts + w, idx = seq_along(starts))

p_dia <- ggplot(dia) +
  geom_rect(
    aes(xmin = 0, xmax = 52, ymin = ymin, ymax = ymax, fill = factor(idx %% 3)),
    colour = "white", linewidth = 0.45, alpha = 0.42
  ) +
  scale_fill_manual(values = pal[c(1, 5, 3)], guide = "none") +
  coord_cartesian(xlim = c(0, 52), ylim = c(400, 1200)) +
  labs(x = "retention time (min)", y = NULL, title = "DIA",
       subtitle = "overlapping windows tile everything, all the time") +
  theme(legend.position = "none")

p_dda | p_dia
Figure 6: 左:DDA 只碎裂被选中的前体,取样是稀疏且随机的。右:DIA 用相互重叠的窗口铺满整个 m/z 范围,取样是系统性的。
维度 DDA DIA PRM
前体选择 实时、依赖强度 无选择,窗口内全采 事先指定
谱图内容 单前体(近似) 多前体混合 单前体、长时间累积
缺失值 较多(随机漏采) 少(系统性覆盖) 只针对目标肽段
数据分析 直接搜库 谱图库 / 伪谱库 / 去卷积 提取离子色谱
典型用途 发现型研究 大队列定量 验证与临床检测

5. 原始数据格式的架构

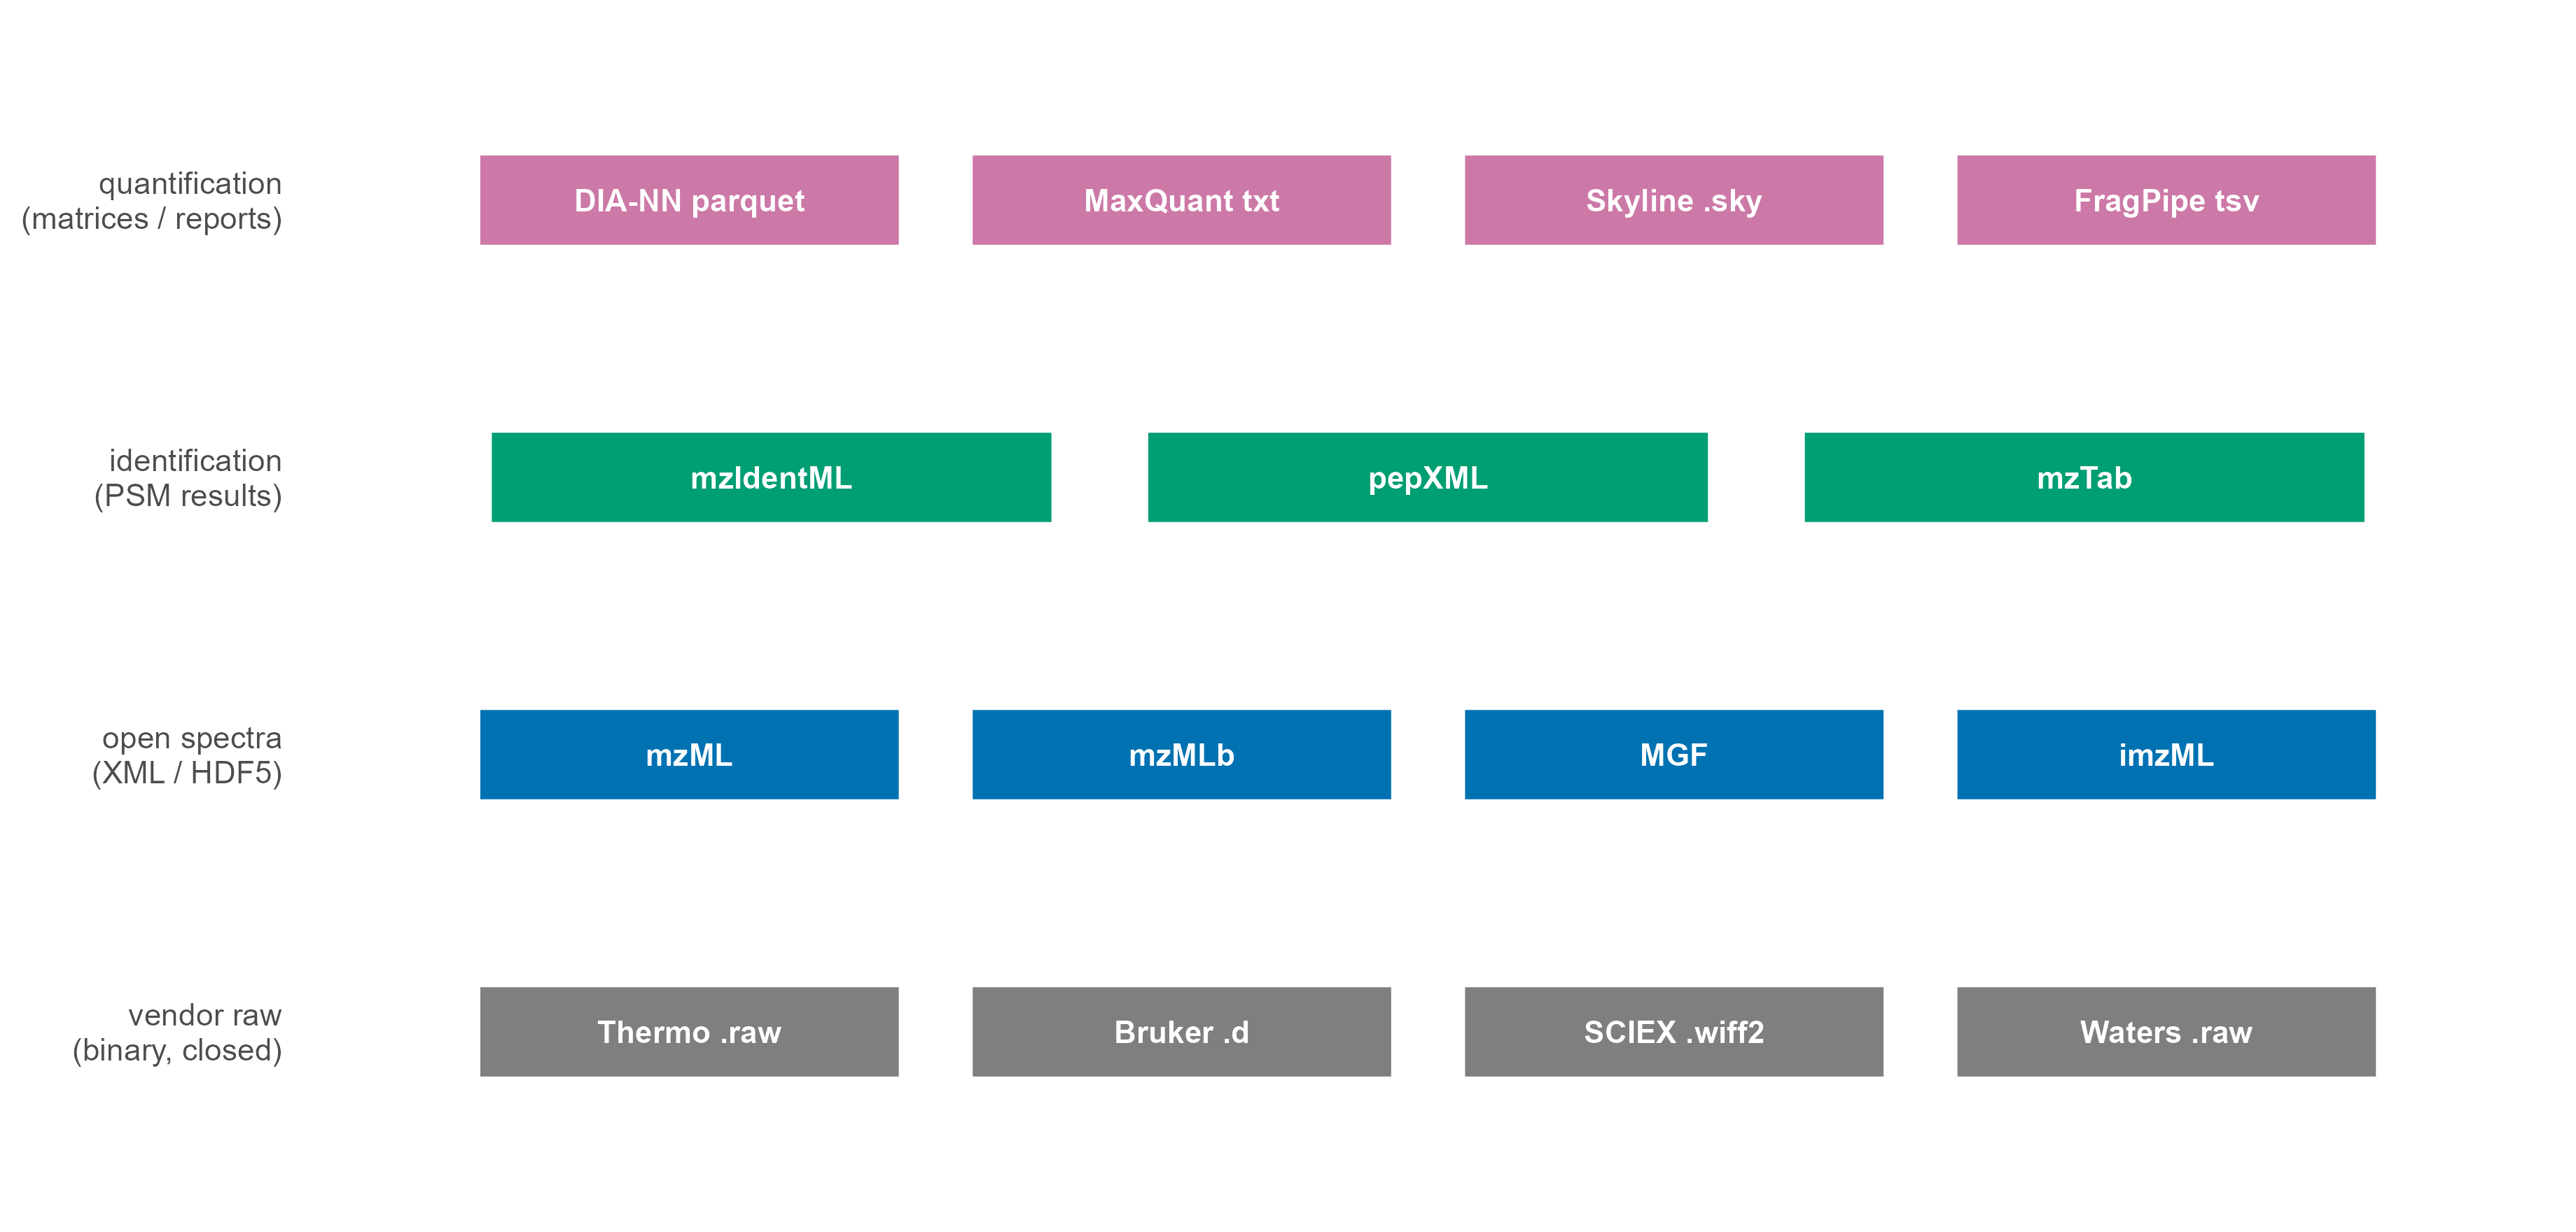
这是本文的核心部分。理解格式的关键,是把文件分成四层:

  1. 厂商原始层:仪器直接写出的文件,包含完整扫描信息,但二进制结构不公开。
  2. 开放谱图层:把原始层无损转换成语义明确的谱图格式,主要是 mzML。
  3. 鉴定结果层:搜库软件输出的 PSM / peptide / protein 记录(mzIdentML、pepXML、mzTab)。
  4. 定量与处理层:矩阵、报告表、项目文件(parquet、TSV、Skyline .sky、FragPipe 输出等)。
fmt <- data.frame(
  layer = factor(
    c(rep("vendor raw", 4), rep("open spectra", 4), rep("identification", 3), rep("quantification", 4)),
    levels = c("vendor raw", "open spectra", "identification", "quantification")
  ),
  name = c(
    "Thermo .raw", "Bruker .d", "SCIEX .wiff2", "Waters .raw",
    "mzML", "mzMLb", "MGF", "imzML",
    "mzIdentML", "pepXML", "mzTab",
    "DIA-NN parquet", "MaxQuant txt", "Skyline .sky", "FragPipe tsv"
  )
) %>%
  group_by(layer) %>%
  mutate(pos = row_number(), n = n()) %>%
  ungroup() %>%
  mutate(
    x = (pos - 0.5) / n,
    y = as.numeric(layer),
    half = 0.43 / n
  )

ggplot(fmt) +
  geom_rect(
    aes(xmin = x - half, xmax = x + half, ymin = y - 0.17, ymax = y + 0.17, fill = layer),
    colour = "white", linewidth = 0.6
  ) +
  geom_text(aes(x, y, label = name), size = 2.8, colour = "white", fontface = "bold") +
  scale_fill_manual(
    values = c("vendor raw" = blog_pal[["grey"]], "open spectra" = blog_pal[["blue"]],
               "identification" = blog_pal[["green"]], "quantification" = blog_pal[["purple"]]),
    guide = "none"
  ) +
  scale_y_continuous(
    breaks = 1:4,
    labels = c("vendor raw\n(binary, closed)", "open spectra\n(XML / HDF5)",
               "identification\n(PSM results)", "quantification\n(matrices / reports)"),
    limits = c(0.55, 4.45)
  ) +
  coord_cartesian(xlim = c(-0.02, 1.02), clip = "off") +
  labs(x = NULL, y = NULL) +
  theme_blog() +
  theme(
    axis.text.x = element_blank(), axis.ticks = element_blank(),
    panel.border = element_blank(), legend.position = "none",
    axis.text.y = element_text(size = 8, lineheight = 0.95)
  )
Figure 7: 四层格式的分工。分析代码通常只和上面三层打交道,但排错时必须回到最底层的原始文件。

5.1 厂商封闭格式

平台 扩展名 实际结构 说明
Thermo Fisher(Orbitrap、Astral、TSQ) .raw 单文件,内部是扫描头 + 二进制数组 最常见;读取需要官方 RawFileReader 或先转换
Bruker(timsTOF、maXis) .d 目录,含 analysis.tdf、analysis.tdf_bin、*.baf 4D 数据(含离子淌度),几乎必须先用厂商 SDK 或 alphatims
SCIEX(TripleTOF、ZenoTOF) .wiff + .wiff.scan,或 .wiff2 元数据与扫描数据分离(新版合并) 转换前务必两个文件放一起
Agilent(Q-TOF、6545) .d 目录,AcqData/*.bin MassHunter 结构
Waters(Synapt、Xevo) .raw(目录) 目录,MassLynx 内部结构 与 Thermo 的 .raw 同名但完全不同

封闭格式的共同问题:

  • 不可逆:一旦厂商停止维护解析库,旧数据就可能读不出来;
  • 平台绑定:想批量处理只能装对应 SDK,Windows/Linux 支持不一致;
  • 仓库不友好:大二进制 + 目录结构,做版本管理几乎不可能。

所以几乎所有正式的蛋白质组学流程都会做一步”转换一次,之后只读开放格式”。常用转换器是 ProteoWizard 的 msconvert 和 Thermo 官方的 ThermoRawFileParser。

5.2 mzML:开放谱图格式的事实标准

mzML 由 HUPO-PSI 维护,本质是一个 XML 索引 + base64 编码的压缩二进制数组。一个最小的结构如下:

<indexedmzML>
  <mzML version="1.1.0">
    <cvList>            <!-- 受控词表:PSI-MS、UO、MS -->
    <fileDescription>   <!-- 文件内容、来源 -->
    <softwareList>      <!-- 写入该文件的软件与版本 -->
    <instrumentConfigurationList>
    <dataProcessingList>
    <run id="run1" startTimeStamp="...">
      <spectrumList count="84213">
        <spectrum id="controllerType=0 controllerNumber=1 scan=2"
                  index="1" defaultArrayLength="412">
          <cvParam cvRef="MS" accession="MS:1000511" name="ms level" value="1"/>
          <scanList count="1">
            <scan>
              <cvParam accession="MS:1000016" name="scan start time" value="0.0212" unitName="minute"/>
            </scan>
          </scanList>
          <binaryDataArrayList count="2">
            <binaryDataArray>
              <cvParam accession="MS:1000514" name="m/z array" unitName="m/z"/>
              <binary>eJztwTEBAAAAwqD1T20...</binary>   <!-- zlib + base64 -->
            </binaryDataArray>
            <binaryDataArray>
              <cvParam accession="MS:1000515" name="intensity array" unitName="number of detector counts"/>
              <binary>eJztwTEBAAAAwqD1T20...</binary>
            </binaryDataArray>
          </binaryDataArrayList>
        </spectrum>
      </spectrumList>
      <chromatogramList count="3"> ... </chromatogramList>
    </run>
  </mzML>
  <indexList>  <!-- offset 索引,支持随机访问 -->
    <index name="spectrum">
      <offset idRef="...scan=2">12345</offset>
    </index>
  </indexList>
</indexedmzML>

几个容易忽略但很重要的细节:

  • 所有字段都由受控词表(CV)定义,例如 MS:1000511 是 ms level,MS:1000514 是 m/z array。这让不同仪器的数据可以语义对齐,也让解析器不必猜字段名。
  • 二进制数组是 zlib 压缩后的 base64,通常 32 位 float(m/z 也可以是 64 位 double)。m/z 用 double、intensity 用 float 是最常见的组合。
  • indexedmzML 才有索引,未索引的 mzML 只能顺序读,处理大队列时会慢一个量级。
  • 谱图顺序是文件顺序,不是 m/z 顺序。很多算法需要先按 m/z 排序,这一步很吃内存。

围绕 mzML 还有几个变体:

格式 载体 适用场景 局限
mzML XML 通用交换格式,几乎所有工具都支持 文件大、解析慢
mzMLb HDF5 大文件、需要快速随机访问 工具支持少
MGF 纯文本 只存 MS2 峰,做谱图库、机器学习 丢失 MS1 与大部分元数据
imzML + .ibd XML + 二进制 质谱成像(MALDI) 只适用于成像数据
mzPeak 列式(parquet 风格) 新提出的高性能开放格式 生态仍在建设中

5.3 鉴定与定量层的格式

搜库之后,数据不再是”谱图”,而是”谱图与肽段的对应关系”:

格式 内容 典型来源
mzIdentML (.mzid) PSM、肽段、蛋白、打分、FDR、修饰 MS-GF+、Comet、Mascot、MS Amanda
pepXML 每个谱图的候选肽段与打分 TPP、Comet
mzTab 蛋白/肽段层面的汇总表(制表符) OpenMS、部分流程
MaxQuant msms.txt / proteinGroups.txt 定量 + 鉴定合并表 MaxQuant
report.tsv / report.parquet 前体级定量(DIA) DIA-NN
.osw SQLite 结构的 OpenSWATH 结果 OpenSWATH
.sky / .blib 项目文件 / 谱图库 Skyline
combined_protein.tsv 蛋白滚动汇总 FragPipe

5.4 同样的数据,不同的体积

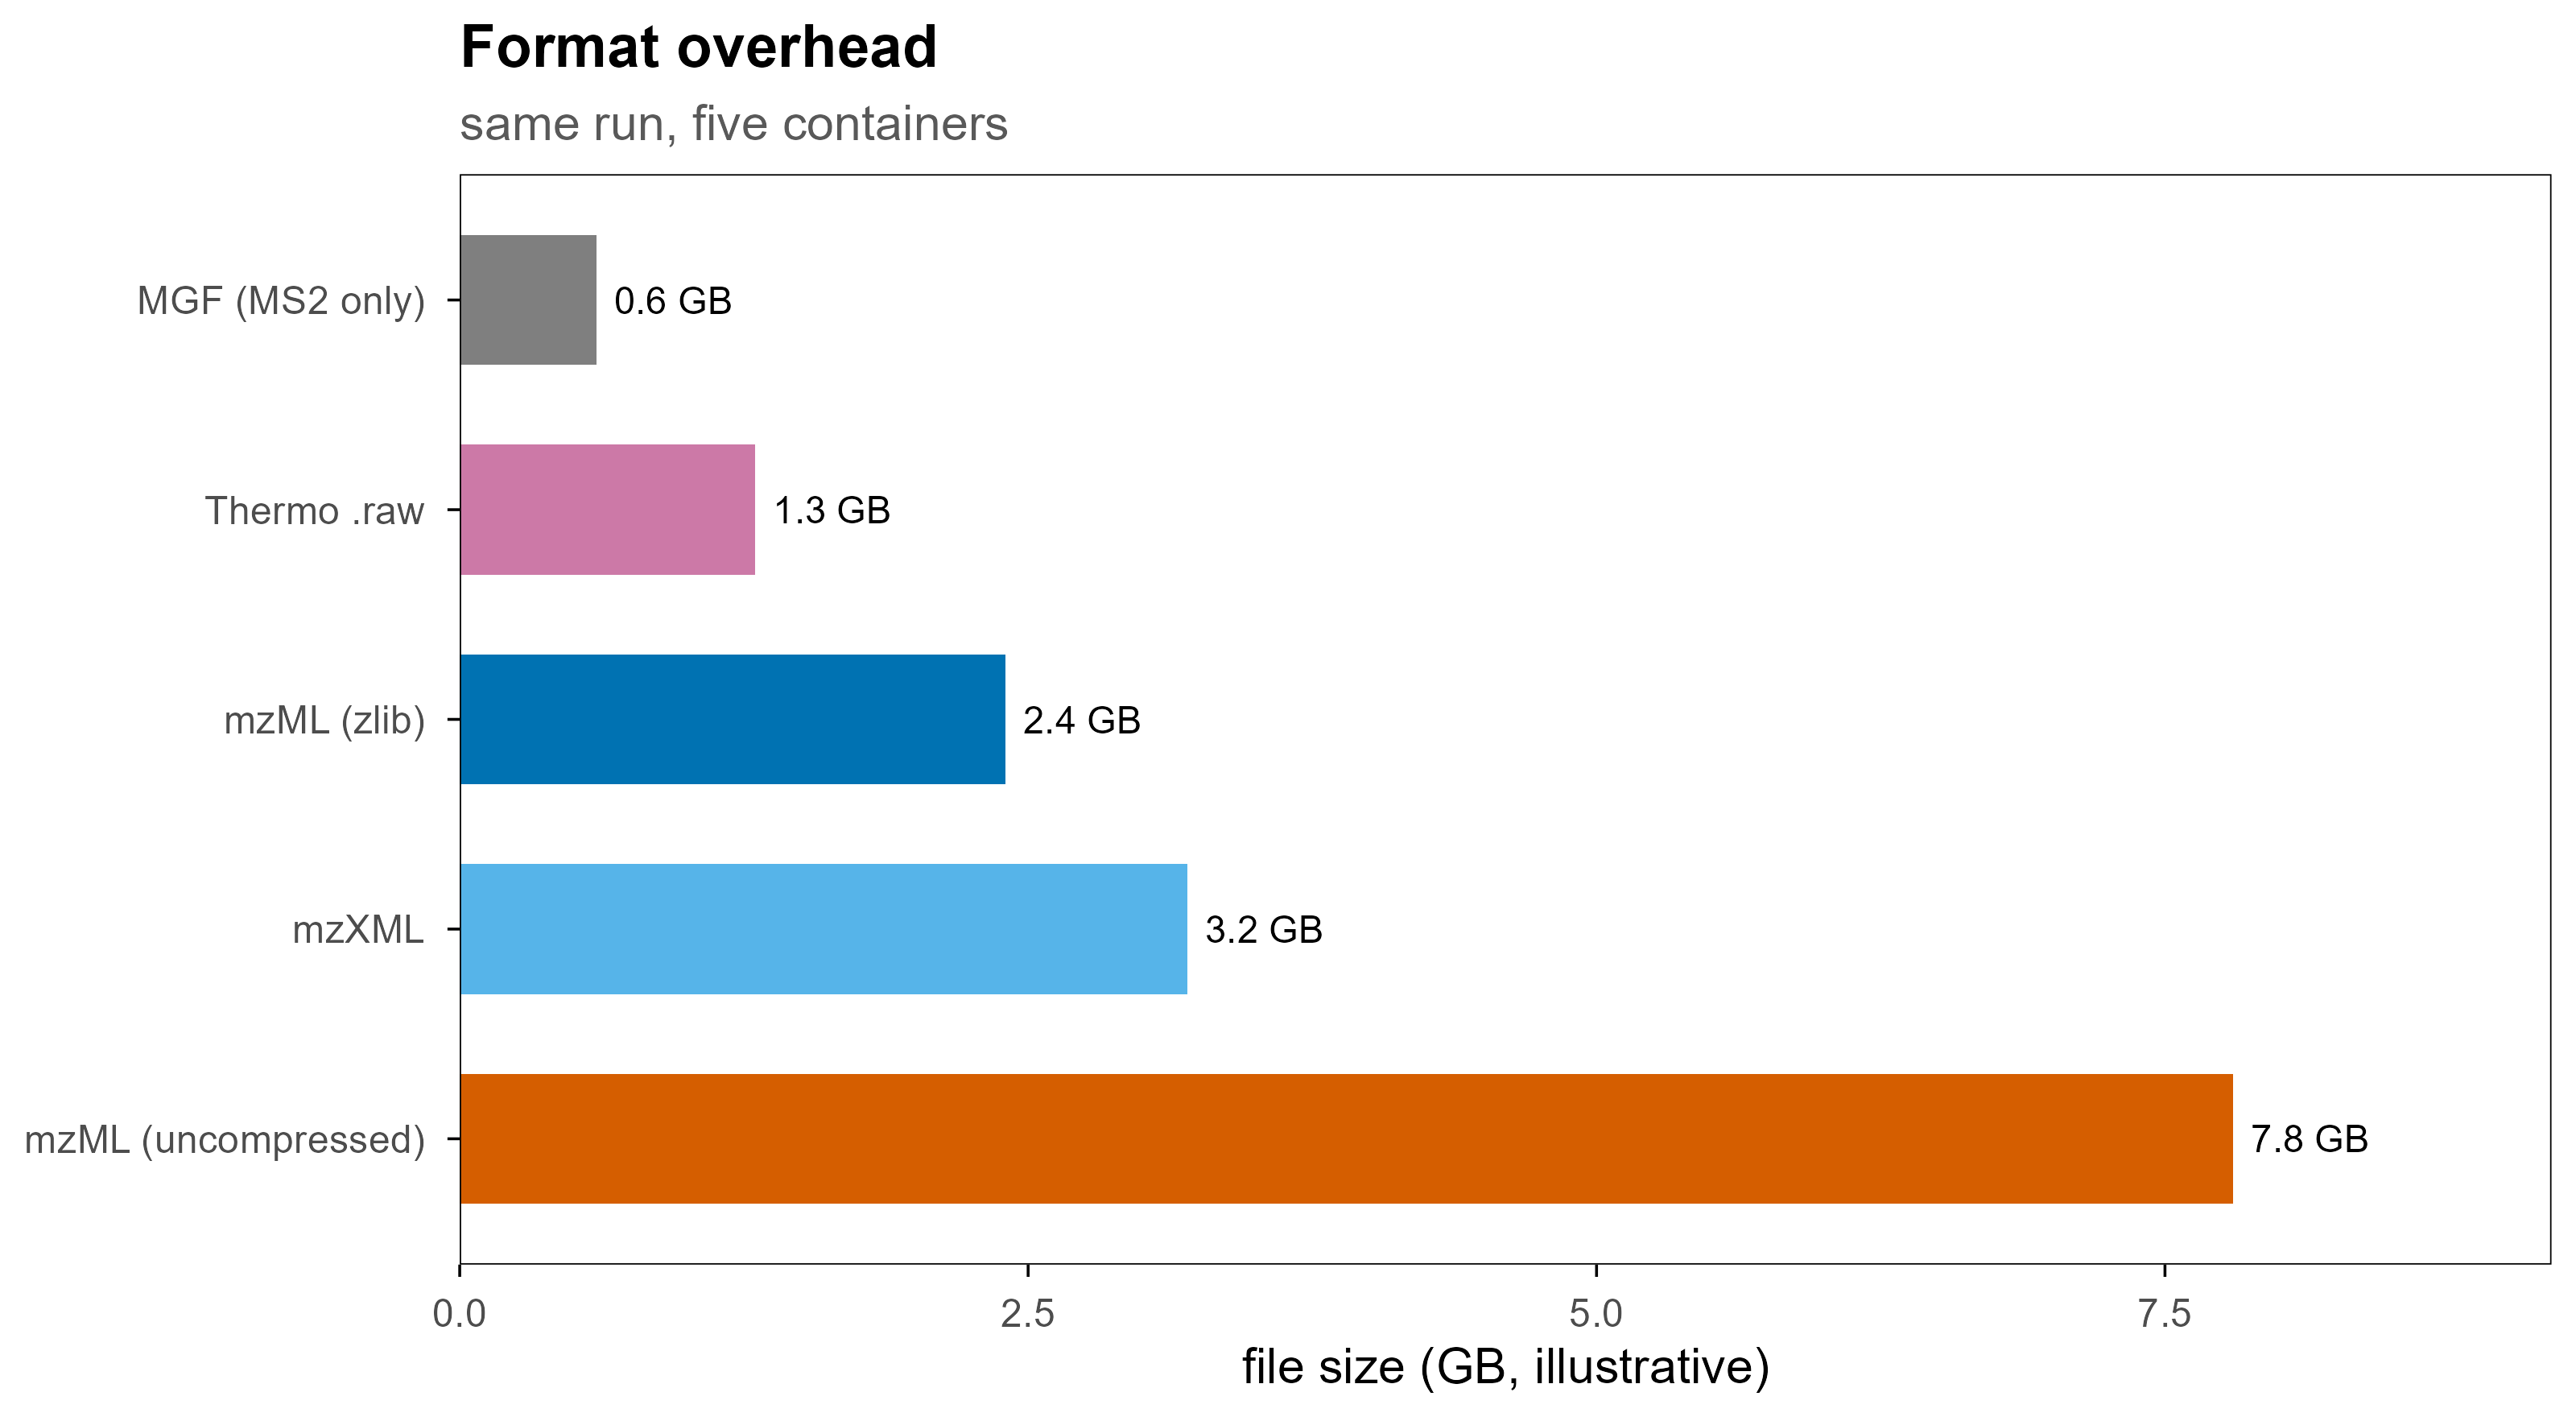
同一次运行转成不同格式,体积差别很大。下面的数字是示意性的量级,不是实测值,但比例关系是真实的:文本格式(MGF)只保留 MS2 所以最小;mzML 不做压缩会膨胀数倍;HDF5 类格式介于两者之间。

sizes <- data.frame(
  format = factor(
    c("MGF (MS2 only)", "Thermo .raw", "mzML (zlib)", "mzXML", "mzML (uncompressed)"),
    levels = rev(c("MGF (MS2 only)", "Thermo .raw", "mzML (zlib)", "mzXML", "mzML (uncompressed)"))
  ),
  gb = c(0.6, 1.3, 2.4, 3.2, 7.8)
)

ggplot(sizes, aes(gb, format, fill = format)) +
  geom_col(width = 0.62, show.legend = FALSE) +
  geom_text(aes(label = paste0(gb, " GB")), hjust = -0.15, size = 3) +
  scale_fill_manual(values = c(
    "MGF (MS2 only)" = blog_pal[["grey"]], "Thermo .raw" = blog_pal[["purple"]],
    "mzML (zlib)" = blog_pal[["blue"]], "mzXML" = blog_pal[["sky"]],
    "mzML (uncompressed)" = blog_pal[["vermillion"]]
  )) +
  scale_x_continuous(limits = c(0, 9.2), expand = c(0, 0)) +
  labs(x = "file size (GB, illustrative)", y = NULL,
       title = "Format overhead", subtitle = "same run, five containers")
Figure 8: 同一次 90 分钟 DDA 运行在不同格式下的示意体积。注意 MGF 体积小是因为它丢掉了 MS1 和大部分元数据,不是因为它更高效。

6. 原始文件里到底存了哪些字段

不管容器是什么,每条扫描通常都带有下列信息。这份清单可以直接用来检查”转换是否丢信息”:

类别 字段 为什么重要
定位 scan number / native ID、index 把 MS2 和触发它的 MS1 关联起来
层级 MS level(1 / 2 / 3) 决定后续处理方式
时间 retention time 色谱对齐、提取离子流
强度 m/z array、intensity array 谱图本体
前体 precursor m/z、charge、单同位素质量 搜库的核心输入
隔离 isolation window 上下界、偏移 DIA 窗口解析必需
碎裂 activation type(HCD/CID/ETD)、碰撞能量 影响谱图可比性
质量 分辨率、质量精度、centroid / profile 决定是否需要 centroiding
淌度 1/K0、CCS、FAIMS CV 4D 数据的第四维
仪器 型号、source、detector、polarity 批次效应排查
汇总 TIC、base peak intensity、injection time、AGC 质控与归一化
色谱 chromatogram list(TIC、BPC、SRM) 快速质控,不必解析全部谱图

一个常见的坑:profile 与 centroid。高分辨仪器原始数据常是 profile(连续采样的峰形),而搜库需要 centroid(峰顶一个 m/z 值)。msconvert 的 --filter "peakPicking true 1-" 就是在做这件事。如果 centroid 参数不合适,同位素峰会被合并或漏掉,直接影响电荷判断。

7. 用 Python 读取

Python 生态里最常用的是 pyteomics(纯 Python、惰性迭代、内存友好)和 pymzml;需要完整工具链时用 pyOpenMS;做谱图相似度与机器学习时用 matchms。

7.1 mzML:流式读取 MS2

from pyteomics import mzml

with mzml.MzML("run.mzML") as reader:
    print(reader.header[:3])          # 软件、仪器等元数据
    for spec in reader:
        if spec["ms level"] != 2:
            continue
        scan = spec["scanList"]["scan"][0]
        rt = scan["scan start time"]   # 默认单位见 unitInfo
        prec = spec["precursorList"]["precursor"][0]
        ion = prec["selectedIonList"]["selectedIon"][0]

        mz = spec["m/z array"]
        intensity = spec["intensity array"]
        print(spec["id"], rt, ion.get("selected ion m/z"),
              ion.get("charge state"), mz[:3], intensity[:3])
        break

要点:

  • mzml.MzML 是迭代器,不会把整个文件读进内存;
  • 数组是 numpy.ndarray,可以直接做向量运算;
  • 电荷、前体 m/z 等键名不保证存在,用 .get();
  • 如果只关心元数据,reader.get_by_id() 配合索引比顺序遍历快得多。

7.2 其他格式

# pymzml:接口更"对象化"
import pymzml
run = pymzml.run.Reader("run.mzML")
for spec in run:
    if spec.ms_level == 2:
        mz, i = spec.peaks("raw")
        break

# matchms:读成标准化 Spectrum 对象,方便算余弦相似度
from matchms.importing import load_from_mzml
spectra = list(load_from_mzml("run.mzML"))
print(spectra[0].metadata)

# pyOpenMS:完整算法库(峰提取、校正、搜库接口)
import pyopenms as oms
exp = oms.MSExperiment()
oms.MzMLFile().load("run.mzML", exp)
print(exp.getNrSpectra(), exp.getNrChromatograms())

# mzIdentML:读鉴定结果
from pyteomics import mzid
with mzid.MzIdentML("search.mzid") as reader:
    for psm in reader:
        print(psm["spectrumID"], psm["chargeState"], psm["PeptideSequence"])

7.3 厂商格式与衍生格式

# Thermo .raw:官方推荐先转开放格式,一次性成本换来长期可复现
# ThermoRawFileParser -i run.raw -o out/ -f 2      (-f 2 = mzML)

# Bruker timsTOF 的 4D 数据
from alphatims.bruker import TimsTOF
data = TimsTOF("run.d", use_bruker_sdk=False)
print(data.shape)          # 语义维度:frame / scan / tof ...

# DIA-NN 的 parquet 报告:列式存储,读取和筛选都快
import pyarrow.parquet as pq
df = pq.read_table("report.parquet").to_pandas()
df = df[df["Q.Value"] <= 0.01]

8. 用 R 读取

R 侧的现代入口是 Spectra(统一的谱图容器,后端可换)。旧的 mzR 仍然可用,很多流程还在用;Thermo 的 .raw 可以直接用 rawrr 读,不必先转换。

8.1 Spectra:推荐方式

library(Spectra)

sp <- Spectra("run.mzML", source = MsBackendMzR())
sp

# 可用的谱图级变量
spectraVariables(sp)

# 常用操作
ms2 <- filterMsLevel(sp, 2L)
ms2 <- filterRt(ms2, c(600, 3600))            # 秒
ms2 <- filterPrecursorMz(ms2, c(400, 1200))
length(ms2)

# 峰数据:每个元素是一个两列矩阵(m/z, intensity)
peaksData(ms2[1:3])

# 元数据表
as.data.frame(spectraData(ms2[1:5], c("spectrumId", "rtime", "precursorMz", "precursorCharge")))

Spectra 的价值在于后端可替换:同一套代码可以读 mzML、MGF、Thermo .raw,甚至换成 SQLite / parquet 后端来处理超过内存的数据集。

# 只含 MS2 的轻量格式
sp_mgf <- Spectra("library.mgf", source = MsBackendMgf())

# 大文件:先落到数据库后端,再按需查询
# sp_db <- Spectra("run.mzML", source = MsBackendMzR())
# sp_db <- setBackend(sp_db, MsBackendSql())

8.2 mzR:老牌底层接口

library(mzR)

f <- openMSfile("run.mzML")
hdr <- header(f)
head(hdr[, c("seqNum", "msLevel", "rtime", "precursorMZ",
             "precursorCharge", "totIonCurrent", "peaksCount")])

pk <- peaks(f, scan = 42)     # 单张谱图:m/z + intensity 两列
chrom <- chromatograms(f)
close(f)

mzR 返回的是扁平数据框,很适合快速探索和质控;缺点是它不理解”谱图集合”这个概念,批量操作要自己写循环。

8.3 直接读 Thermo .raw

library(rawrr)

idx <- readIndex("run.raw")
head(idx)

sp <- readSpectrum("run.raw", scan = idx$scanNumber[1:5])
str(sp[[1]])          # scan header + mZ / intensity

rawrr 通过 Thermo 的 RawFileReader 工作,因此只能在 Windows / Linux 的对应运行时下使用,并且受厂商许可约束。

8.4 鉴定与定量结果

library(PSMatch)

psm <- readMzId("search.mzid")
head(psm)

# 过滤到 1% FDR
psm_f <- filterFdr(psm, fdr = 0.01, keep = TRUE)
table(psm_f$decoy)
library(QFeatures)

# 从 PSM 到 peptide 再到 protein 的聚合容器
qf <- QFeatures(list(psms = psm_assays, peptides = peptide_assays,
                     proteins = protein_assays))
qf <- aggregateFeatures(qf, i = "peptides", fcol = "Protein",
                        name = "proteins_agg", fun = colSums)

下游的差异分析通常接 limma、DEP 或 MSstats;DIA 数据常用 MSstats、DIA-NN 的 R 包或 Spectronaut 导出的矩阵。

9. 从谱图到蛋白表

读取只是第一步。真正决定结果质量的是中间这几步。

9.1 搜库与 FDR

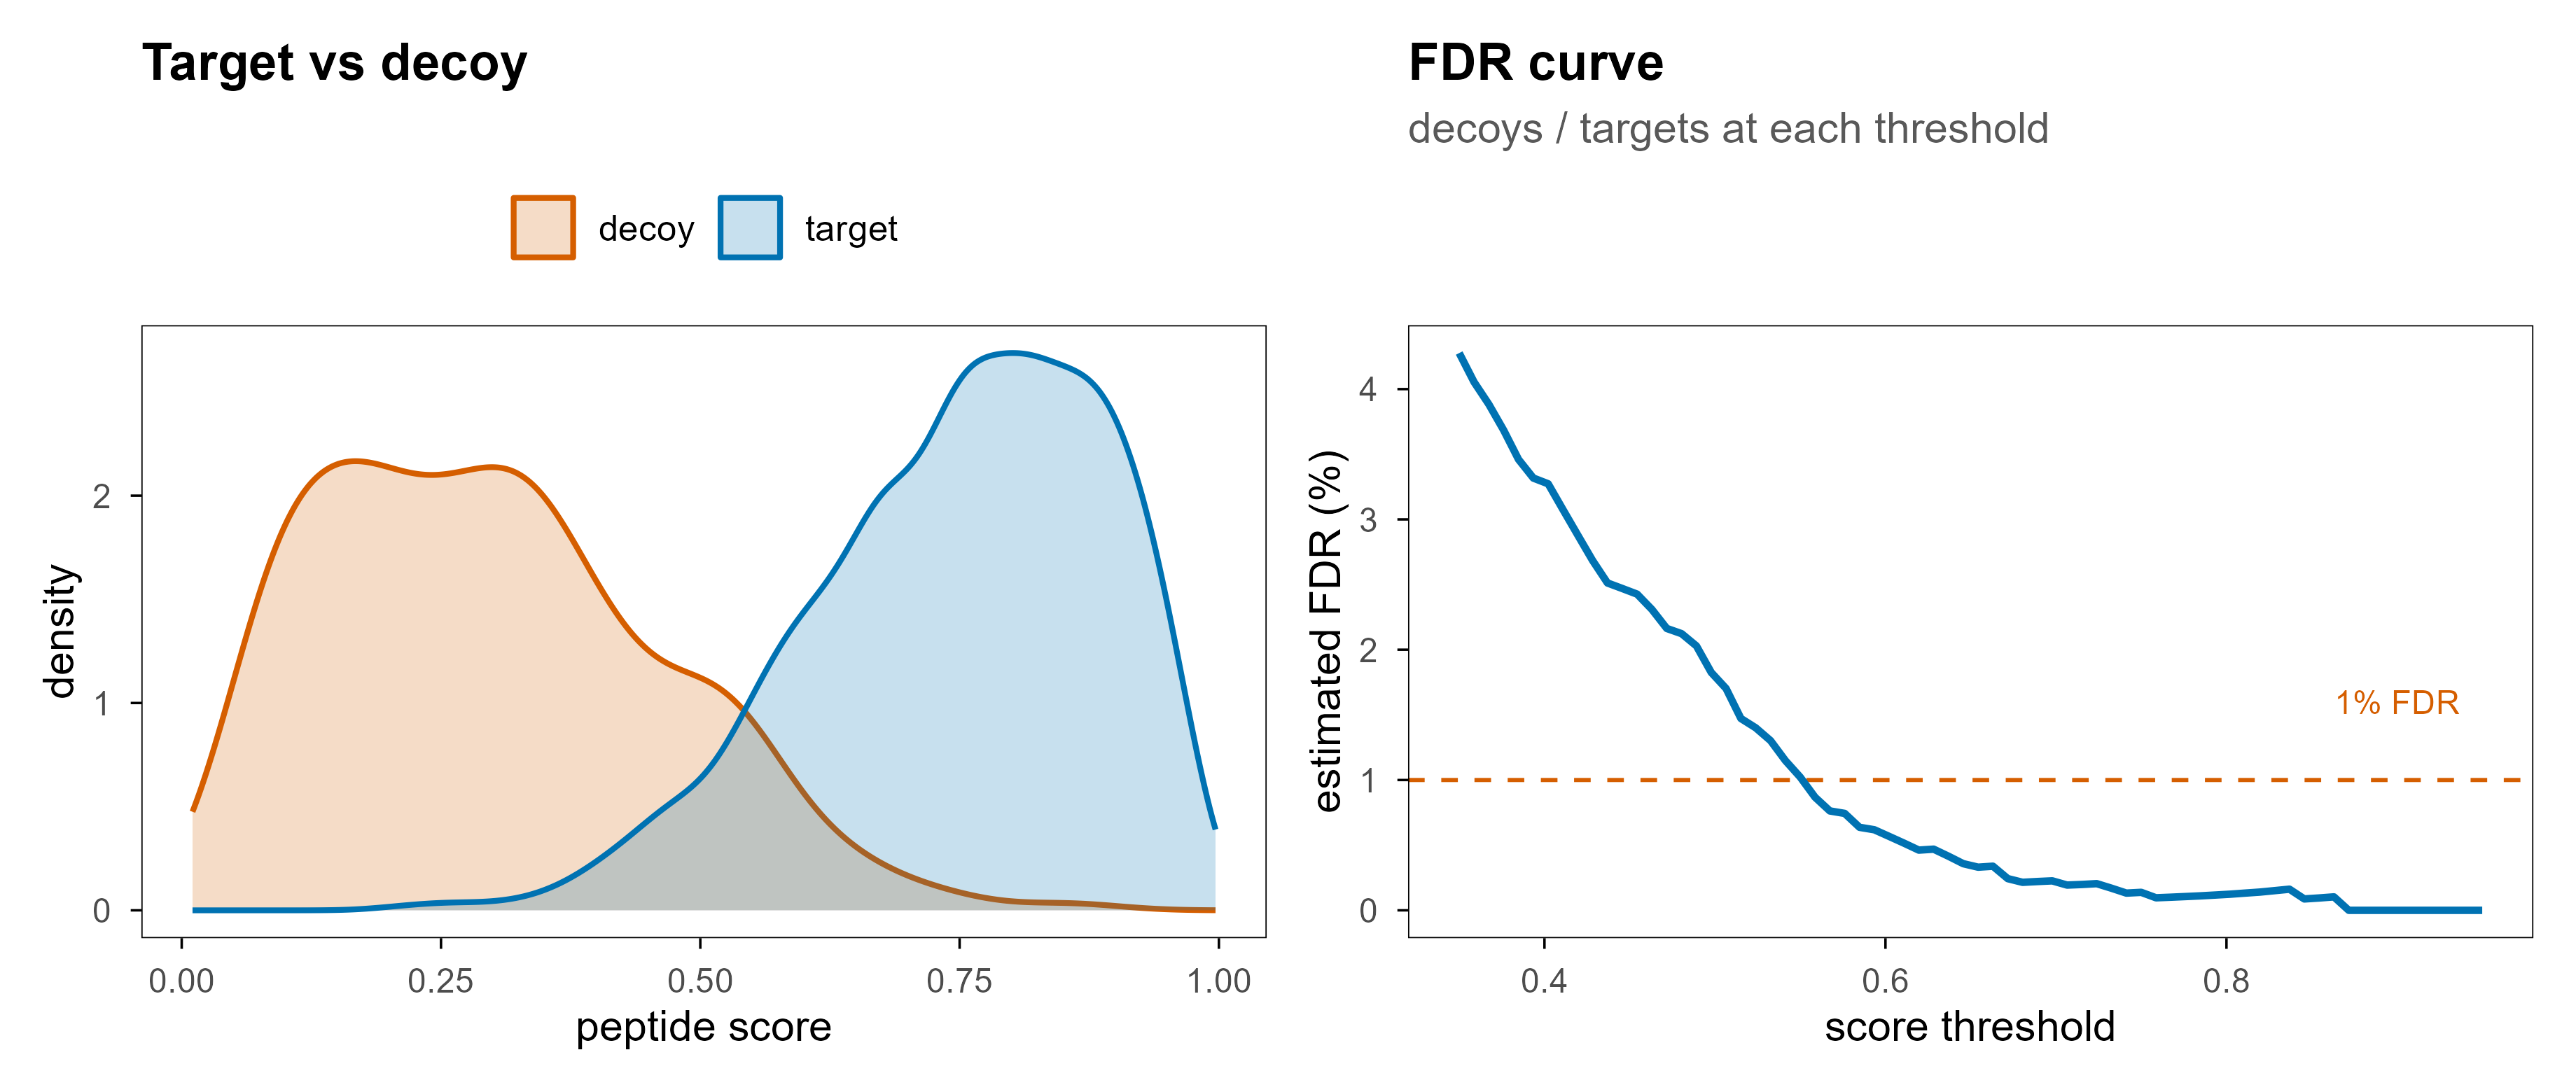
搜库的本质是:给定一张 MS2 谱图和前体质量,在理论酶切肽段库里找最匹配的序列,并给出打分。为了让”匹配”有统计意义,业界通用 target-decoy 策略:把真实库和反转/打乱的诱饵库一起搜,用诱饵命中数估计假阳性。

set.seed(11)
target <- rbeta(4000, 6, 2)
decoy  <- rbeta(500, 2, 5)
score_df <- bind_rows(
  data.frame(score = target, type = "target"),
  data.frame(score = decoy, type = "decoy")
)

p_dens <- ggplot(score_df, aes(score, fill = type, colour = type)) +
  geom_density(alpha = 0.22, linewidth = 0.7, adjust = 1.1) +
  scale_fill_manual(values = c(target = blog_pal[["blue"]], decoy = blog_pal[["vermillion"]])) +
  scale_colour_manual(values = c(target = blog_pal[["blue"]], decoy = blog_pal[["vermillion"]])) +
  labs(x = "peptide score", y = "density", fill = NULL, colour = NULL,
       title = "Target vs decoy") +
  theme(legend.position = "top")

thr <- seq(0.35, 0.95, length.out = 70)
fdr_df <- data.frame(
  threshold = thr,
  fdr = sapply(thr, function(t) sum(decoy >= t) / max(sum(target >= t), 1)) * 100
)

p_fdr <- ggplot(fdr_df, aes(threshold, fdr)) +
  geom_hline(yintercept = 1, linetype = "dashed", colour = blog_pal[["vermillion"]], linewidth = 0.5) +
  geom_line(colour = blog_pal[["blue"]], linewidth = 0.9) +
  annotate("text", x = 0.9, y = 1.6, label = "1% FDR", size = 3,
           colour = blog_pal[["vermillion"]]) +
  labs(x = "score threshold", y = "estimated FDR (%)",
       title = "FDR curve", subtitle = "decoys / targets at each threshold") +
  theme(legend.position = "none")

p_dens | p_fdr
Figure 9: 左:target 与 decoy 的打分分布,decoy 整体偏低。右:随打分阈值变化的估计 FDR,1% 处对应的就是常用的过滤线。

需要注意的几个细节:

  • FDR 可以是在 PSM、peptide、protein 三个层级上控制的,数值不可互换;
  • 蛋白层面的 FDR 不等于 PSM 层面的 FDR,蛋白推断需要单独的模型(如 picked-protein、hierarchical);
  • 修饰位点还需要定位概率(localization probability),否则会把”有修饰”和”修饰在哪个残基”混为一谈。

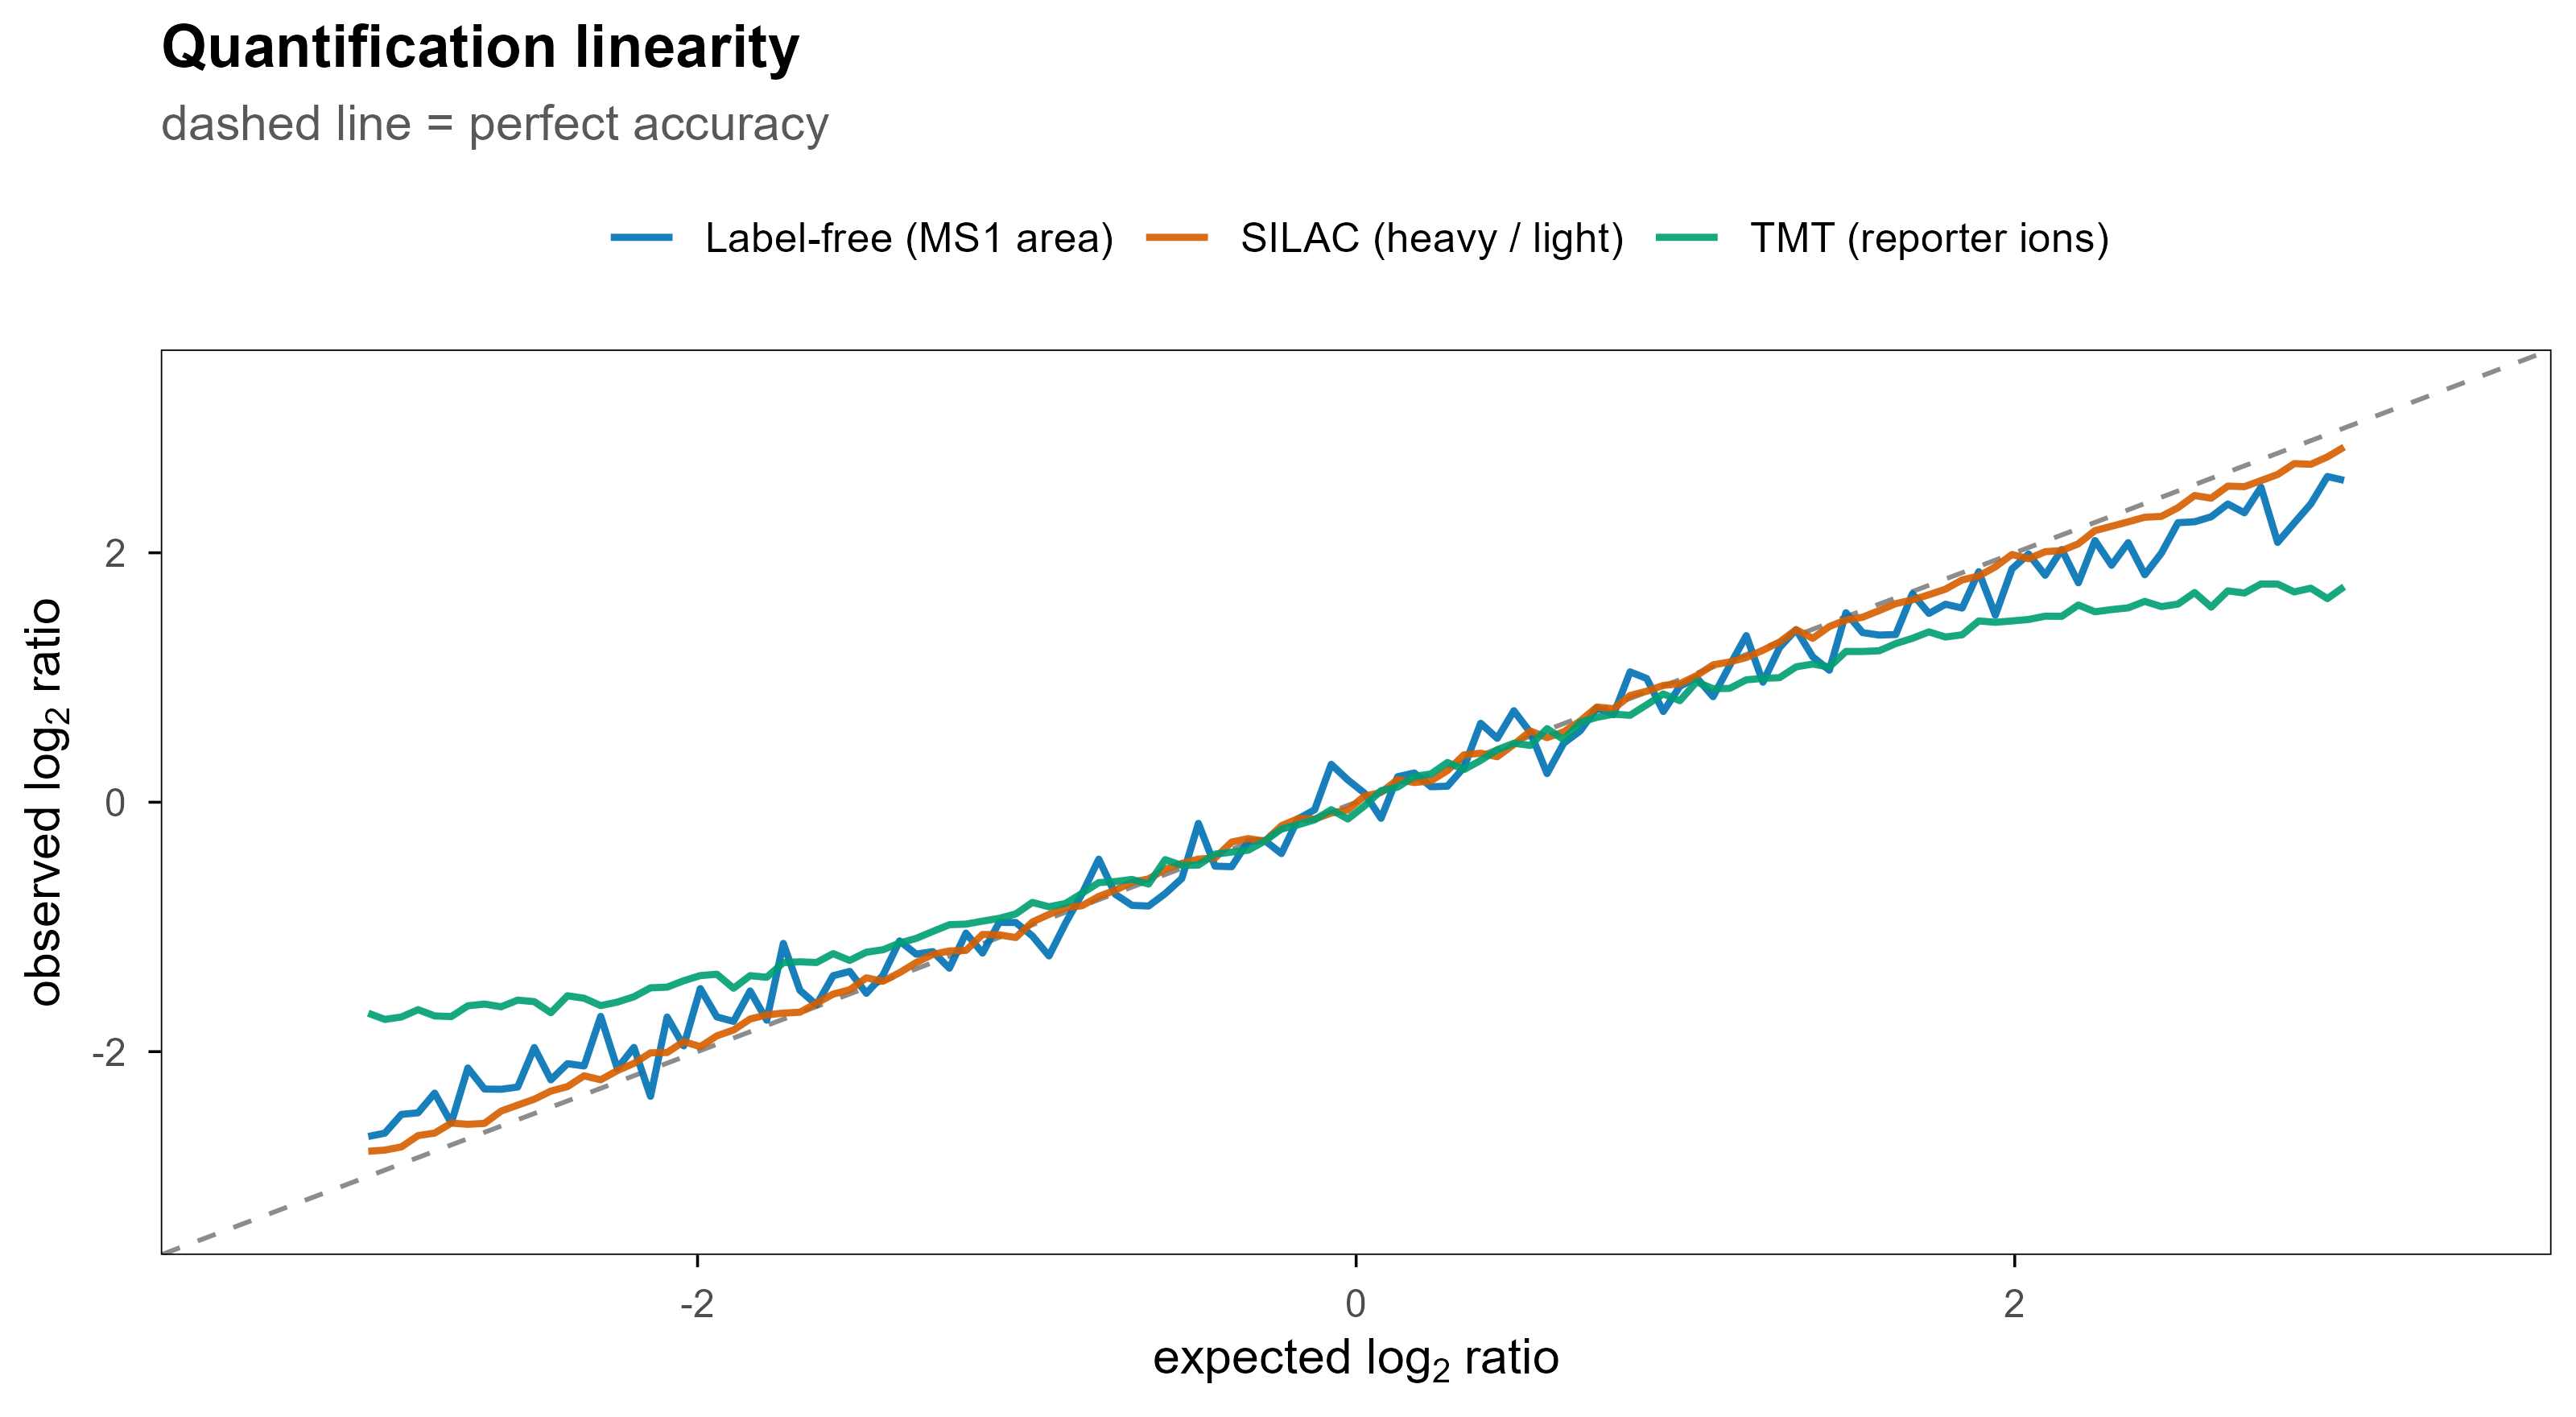
9.2 四条定量路线

策略 原理 优点 局限
Label-free(LFQ) 比较同一肽段在不同运行中的 MS1 峰面积 成本低、样本数不受限 运行间波动大,缺失值多
同重标(TMT / iTRAQ) 不同样本标记后混样,MS2 里读报告离子 多重、通量高、缺失少 比值压缩(ratio compression)
代谢标(SILAC) 轻重同位素培养,混样后成对出现 定量最准 只能用于可培养细胞
DIA 定量 从混合 MS2 中提取前体色谱 覆盖稳定、重复性好 依赖谱图库质量
x <- seq(-3, 3, length.out = 120)
set.seed(9)
quant_df <- bind_rows(
  data.frame(expected = x, observed = x * (1 - 0.05 * abs(x)) + rnorm(length(x), 0, 0.17),
             method = "Label-free (MS1 area)"),
  data.frame(expected = x, observed = x * (1 - 0.14 * abs(x)) + rnorm(length(x), 0, 0.04),
             method = "TMT (reporter ions)"),
  data.frame(expected = x, observed = x * (1 - 0.02 * abs(x)) + rnorm(length(x), 0, 0.03),
             method = "SILAC (heavy / light)")
)

ggplot(quant_df, aes(expected, observed, colour = method)) +
  geom_abline(slope = 1, intercept = 0, linetype = "dashed", colour = "grey55") +
  geom_line(linewidth = 0.75, alpha = 0.9) +
  scale_colour_manual(values = pal[c(1, 2, 3)]) +
  coord_cartesian(xlim = c(-3.3, 3.3), ylim = c(-3.3, 3.3)) +
  labs(x = expression("expected "*log[2]*" ratio"), y = expression("observed "*log[2]*" ratio"),
       colour = NULL, title = "Quantification linearity",
       subtitle = "dashed line = perfect accuracy") +
  theme(legend.position = "top")
Figure 10: 三种策略的定量线性度示意。同重标在高比值端会出现明显压缩,代谢标最接近理想直线,label-free 噪声最大。

9.3 缺失值不是随机的

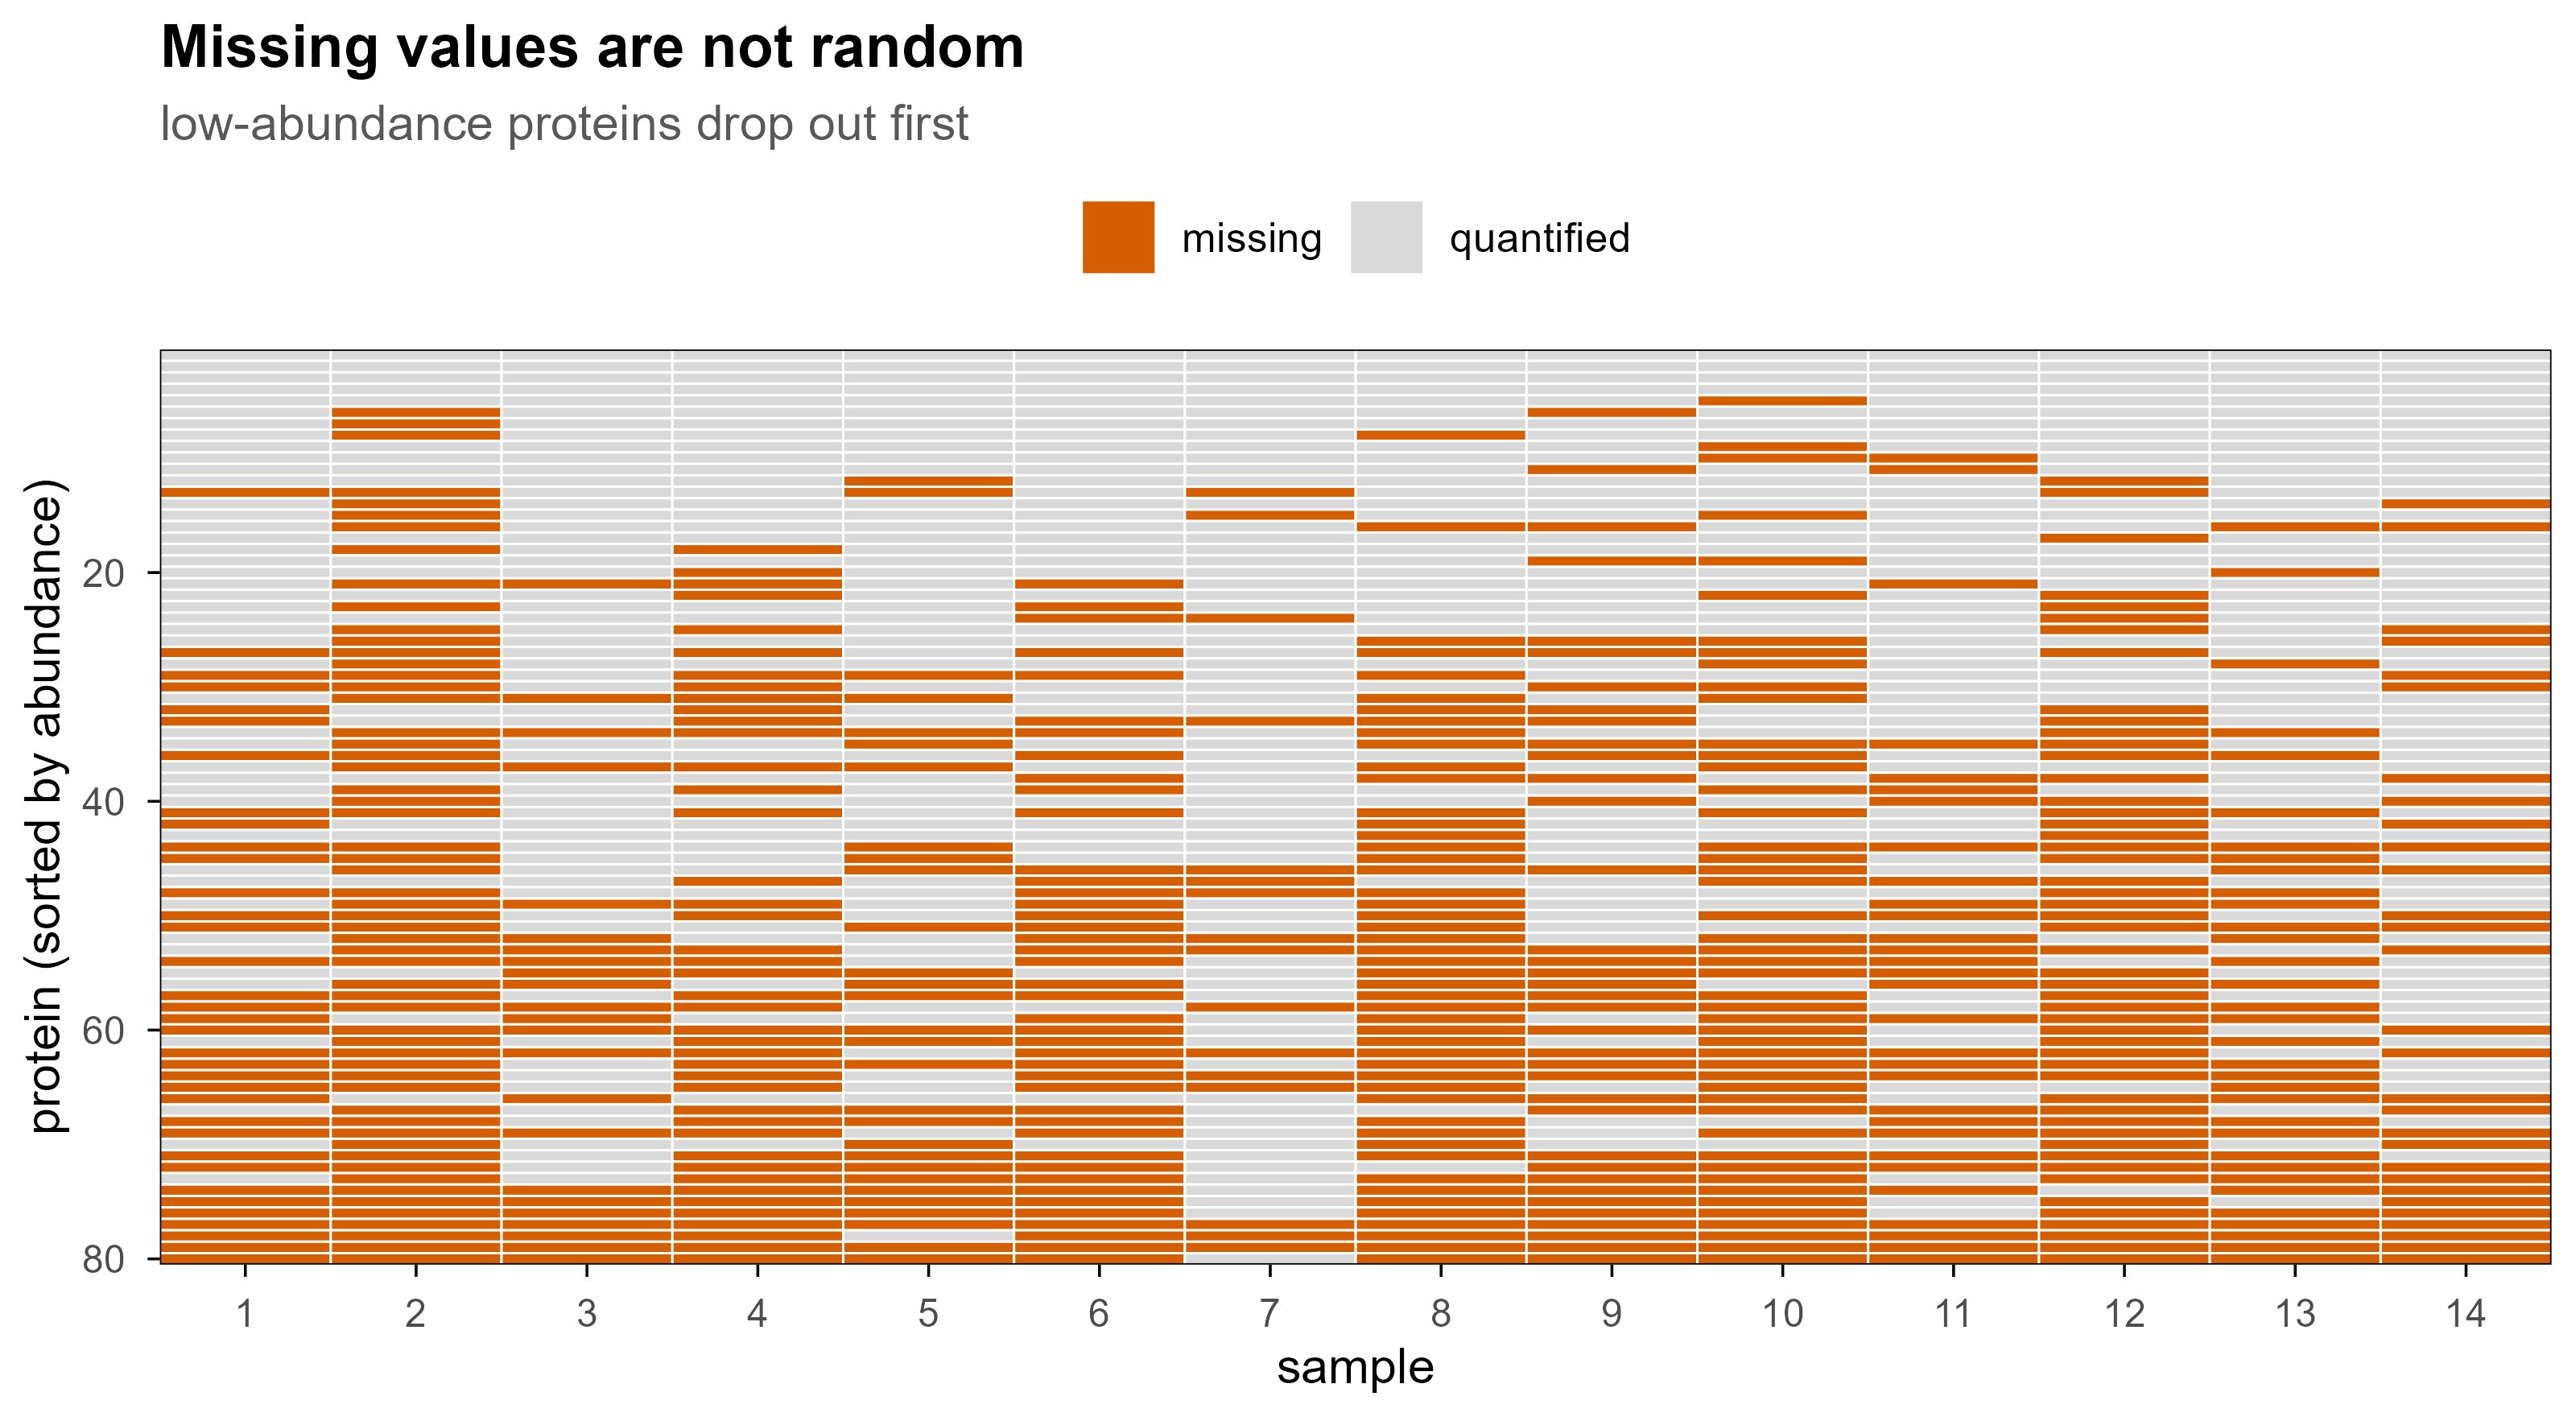
蛋白质组数据里的缺失值主要有三种来源:低于检测限(MNAR)、DDA 随机漏采、以及数据处理过滤。绝大多数情况下,缺失与丰度相关,所以”用 0 填补”或”用均值填补”都会系统性扭曲结果。

set.seed(5)
n_prot <- 80
n_smp <- 14
base <- sort(rnorm(n_prot, 0, 1), decreasing = TRUE)
mat <- outer(base, rnorm(n_smp, 0, 0.55), "+")
p_miss <- plogis(-mat * 1.5)
miss <- matrix(runif(n_prot * n_smp) < p_miss, n_prot, n_smp)

miss_df <- expand.grid(protein = 1:n_prot, sample = 1:n_smp)
miss_df$status <- ifelse(as.vector(miss), "missing", "quantified")

ggplot(miss_df, aes(sample, protein, fill = status)) +
  geom_tile(colour = "white", linewidth = 0.25) +
  scale_fill_manual(values = c(quantified = "#D9D9D9", missing = blog_pal[["vermillion"]])) +
  scale_y_reverse(expand = c(0, 0)) +
  scale_x_continuous(expand = c(0, 0), breaks = 1:n_smp) +
  labs(x = "sample", y = "protein (sorted by abundance)", fill = NULL,
       title = "Missing values are not random",
       subtitle = "low-abundance proteins drop out first")
Figure 11: 低丰度蛋白优先缺失(MNAR)。这类矩阵不能用简单的均值或零填补,通常需要过滤、删失模型或专门的归一化方法。

常用的处理路线:

  • 过滤:要求至少在 70% 的样本中被定量(大队列里更常见);
  • 删失模型:MSstats、DEqMS 的思路,把缺失当作”低于检测限”而不是随机缺失;
  • 归一化:中位数、quantile、vsn、或基于内参/峰面积总和;
  • 批次校正:limma::removeBatchEffect、ComBat,但必须在建模时保留批次因子。

10. 基于质谱之外,还有哪些蛋白质组学方法

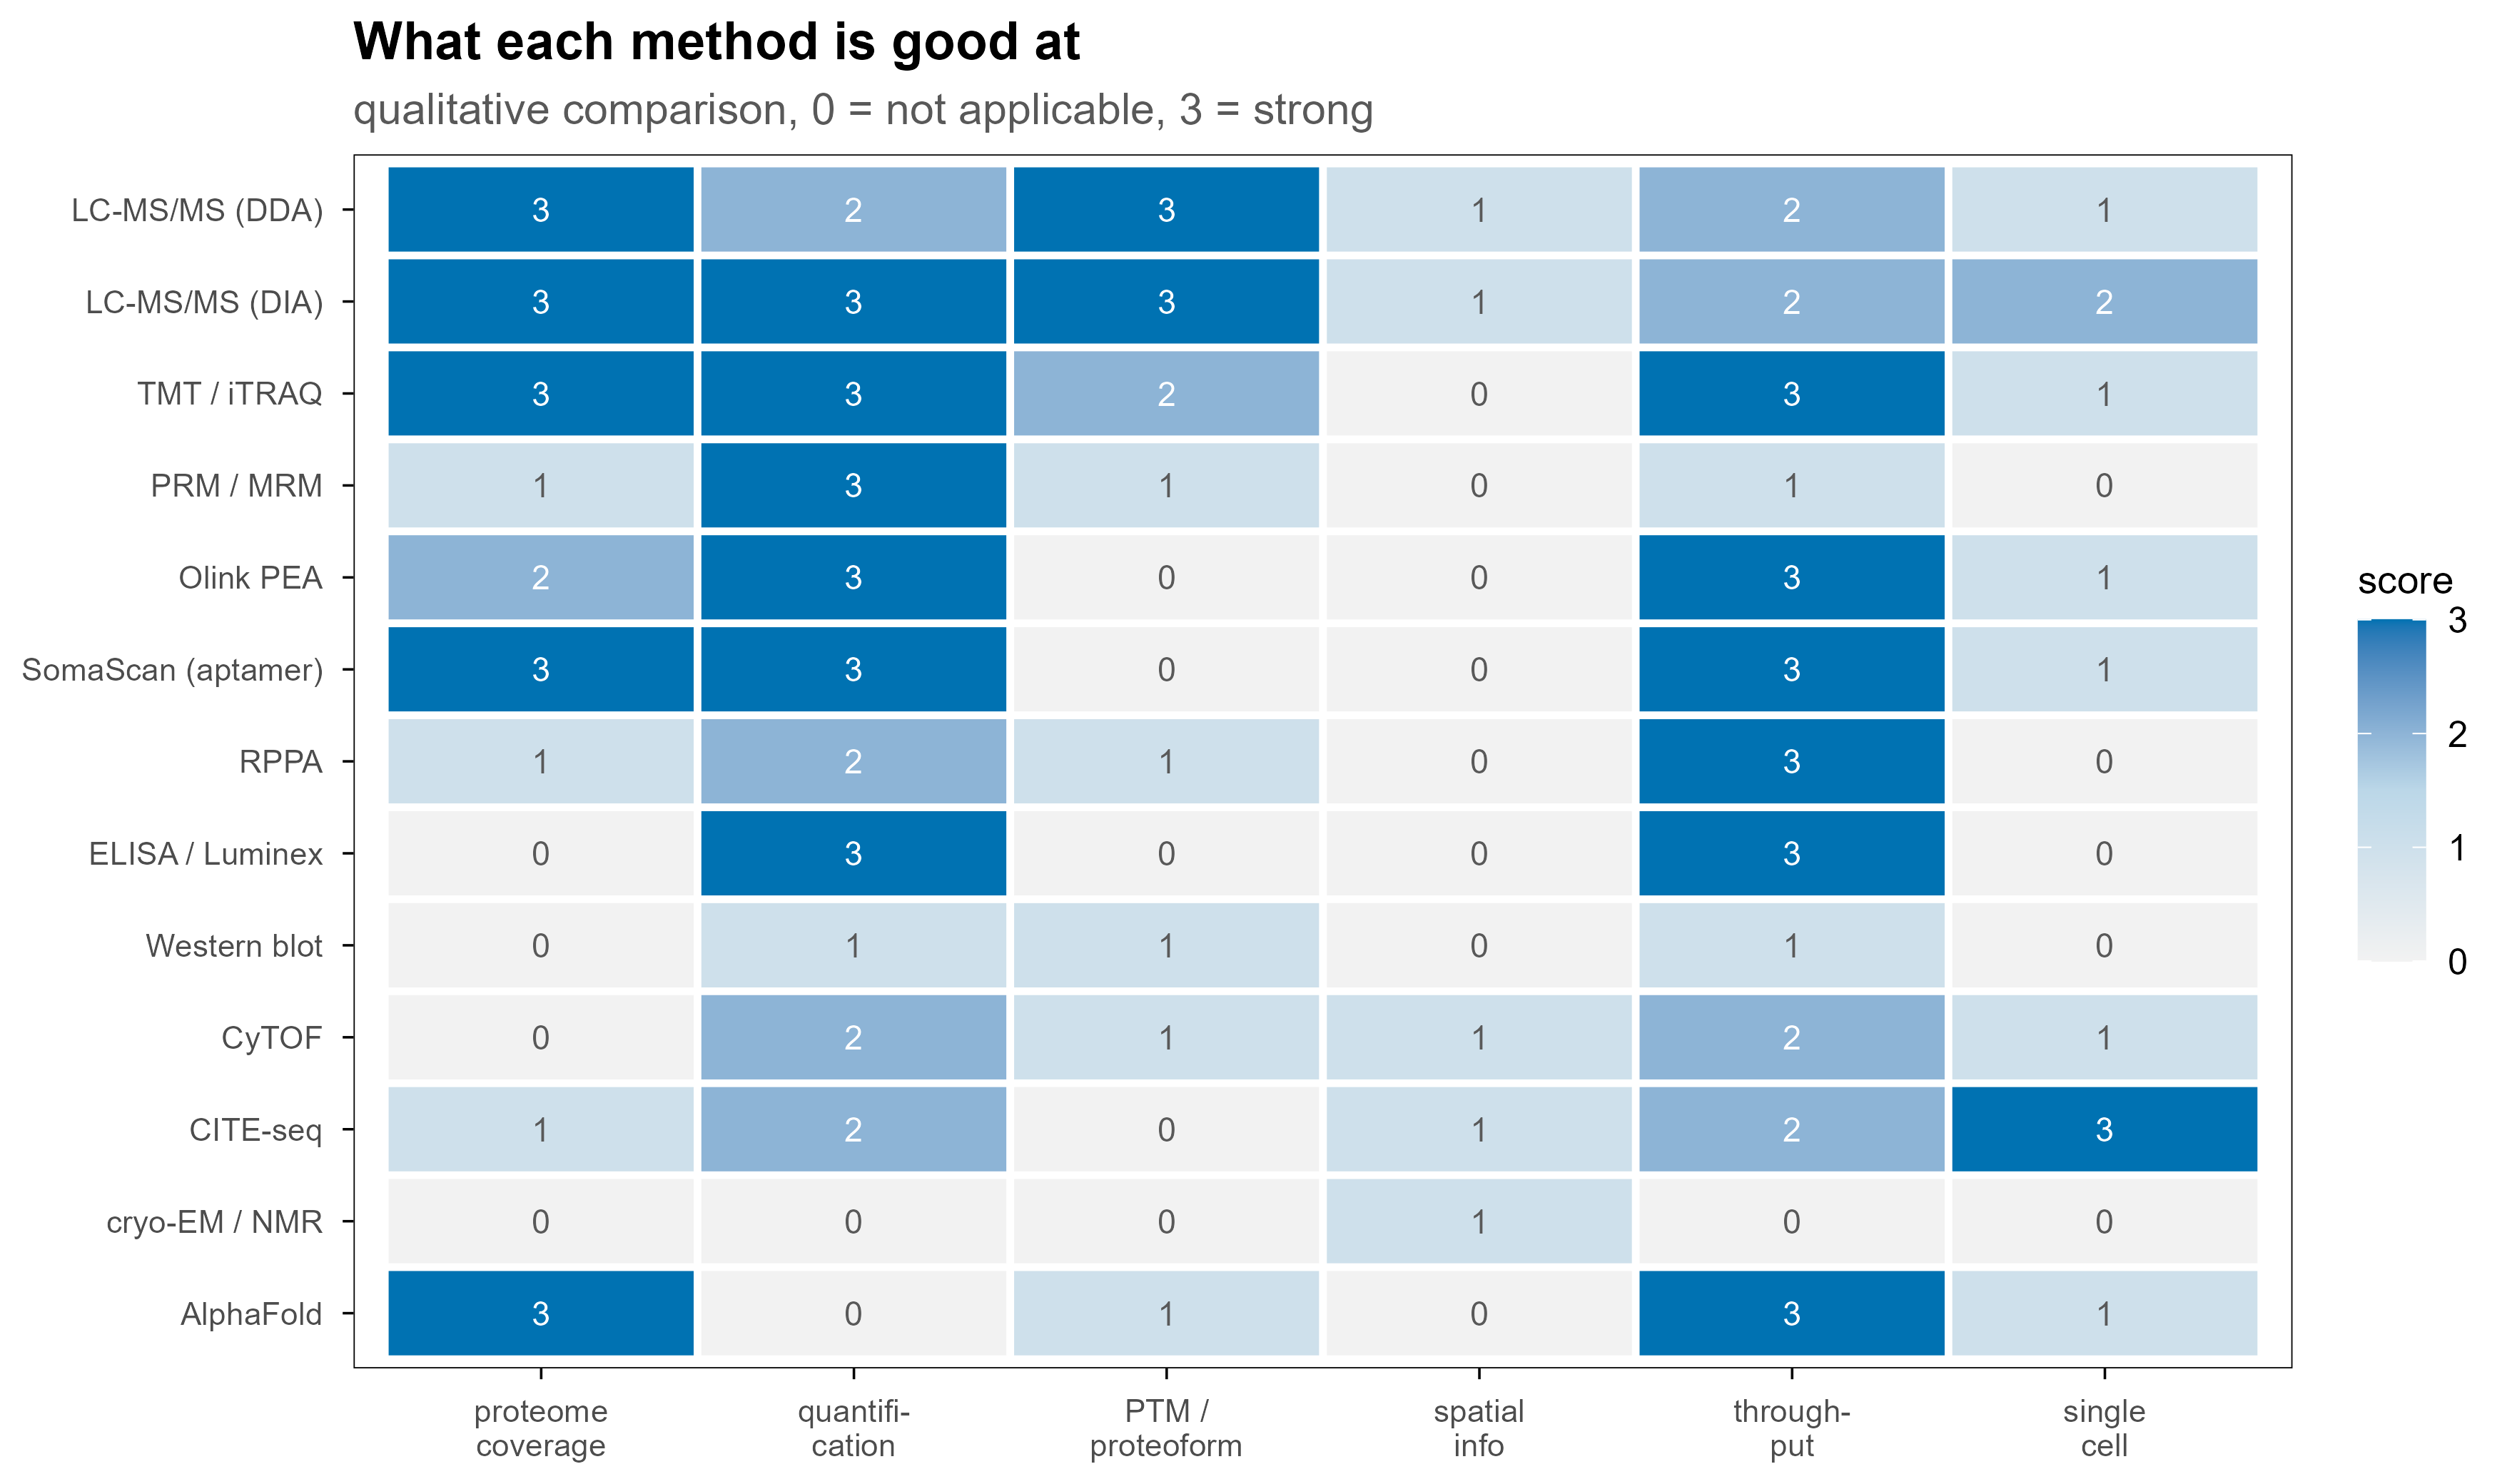
质谱不是唯一路线。不同方法在”覆盖广度、定量精度、空间信息、通量”上各有取舍,实际研究里常常是组合使用。

cap <- data.frame(
  method = c(
    "LC-MS/MS (DDA)", "LC-MS/MS (DIA)", "TMT / iTRAQ", "PRM / MRM",
    "Olink PEA", "SomaScan (aptamer)", "RPPA", "ELISA / Luminex",
    "Western blot", "CyTOF", "CITE-seq", "cryo-EM / NMR", "AlphaFold"
  ),
  coverage       = c(3, 3, 3, 1, 2, 3, 1, 0, 0, 0, 1, 0, 3),
  quantification = c(2, 3, 3, 3, 3, 3, 2, 3, 1, 2, 2, 0, 0),
  PTM            = c(3, 3, 2, 1, 0, 0, 1, 0, 1, 1, 0, 0, 1),
  spatial        = c(1, 1, 0, 0, 0, 0, 0, 0, 0, 1, 1, 1, 0),
  throughput     = c(2, 2, 3, 1, 3, 3, 3, 3, 1, 2, 2, 0, 3),
  single_cell    = c(1, 2, 1, 0, 1, 1, 0, 0, 0, 1, 3, 0, 1)
) %>%
  pivot_longer(-method, names_to = "dimension", values_to = "score") %>%
  mutate(
    method = factor(method, levels = rev(c(
      "LC-MS/MS (DDA)", "LC-MS/MS (DIA)", "TMT / iTRAQ", "PRM / MRM",
      "Olink PEA", "SomaScan (aptamer)", "RPPA", "ELISA / Luminex",
      "Western blot", "CyTOF", "CITE-seq", "cryo-EM / NMR", "AlphaFold"
    ))),
    dimension = factor(dimension,
      levels = c("coverage", "quantification", "PTM", "spatial", "throughput", "single_cell"),
      labels = c("proteome\ncoverage", "quantifi-\ncation", "PTM /\nproteoform", "spatial\ninfo", "through-\nput", "single\ncell"))
  )

ggplot(cap, aes(dimension, method, fill = score)) +
  geom_tile(colour = "white", linewidth = 0.9) +
  geom_text(aes(label = score, colour = score >= 2), size = 3, show.legend = FALSE) +
  scale_fill_gradientn(colours = c("#F2F2F2", "#BBD7E8", blog_pal[["blue"]]), limits = c(0, 3)) +
  scale_colour_manual(values = c(`TRUE` = "white", `FALSE` = "grey35")) +
  labs(x = NULL, y = NULL, fill = "score",
       title = "What each method is good at",
       subtitle = "qualitative comparison, 0 = not applicable, 3 = strong") +
  theme(
    axis.text.x = element_text(size = 8, lineheight = 0.9),
    axis.text.y = element_text(size = 8),
    legend.position = "right"
  )
Figure 12: 不同蛋白质组学方法的能力画像。分数是定性的(0–3),用于比较方法的相对取舍,不代表任何具体产品的性能。

10.1 亲和与抗体类

这类方法的共同点是用已知的结合试剂识别已知的目标,因此只能测”你已经有试剂的东西”。

  • ELISA:单靶标、定量准确、临床金标准,但一次一个蛋白。
  • Luminex xMAP:把抗体挂在荧光编码微球上,一次几十个靶标。
  • RPPA(反相蛋白阵列):把样本点成阵列再用抗体探测,适合信号通路蛋白和磷酸化位点,通量高但依赖抗体质量。
  • Olink PEA:一对带 DNA 标签的抗体同时结合目标,标签互补后通过 qPCR 或 NGS 读出,双抗体识别显著降低非特异信号;样本量小(µL 级),适合大队列血浆。
  • SomaScan:用慢速解离速率(slow off-rate)的 DNA 适配体代替抗体,可覆盖数千种蛋白,但适配体特异性需要交叉验证。

10.2 流式与单细胞

  • 流式细胞术:荧光标记抗体,单细胞、多参数,通量极高,但参数受荧光通道限制(通常 10–30 个)。
  • CyTOF(质谱流式):用金属同位素标记抗体,用 ICP-TOF 读出,通道数可到 40–50,几乎没有自发荧光;代价是细胞被破坏、通量低于荧光流式。
  • CITE-seq:把抗体偶联到 DNA 条形码上,和单细胞转录组一起测序,实现同一细胞的蛋白 + mRNA 联合测量。
  • 单细胞蛋白质组(SCoPE-MS / SCoPE2、nanoPOTS):质谱路线的单细胞方案,目前每个细胞可鉴定数百到两千个蛋白,仍处于快速发展阶段。

10.3 相互作用与邻近标记

  • AP-MS:把诱饵蛋白拉下来,用质谱鉴定共沉淀的伙伴。
  • BioID / TurboID / APEX:用工程化酶给邻近蛋白打上生物素标签,再富集鉴定,能捕获弱且瞬时的相互作用。
  • 酵母双杂交、噬菌体展示:二元互作的高通量筛选,假阳性/假阴性都较明显。

10.4 结构与计算

  • X-ray 晶体学:原子分辨率,但需要结晶。
  • cryo-EM:近原子分辨率、不需要结晶,适合大复合物;通量和样品要求仍是门槛。
  • NMR:溶液态、可看动态,但分子量上限明显。
  • HDX-MS、交联质谱(XL-MS):质谱路线的结构探针,给出溶剂可及性和距离约束,常与结构预测互补。
  • AlphaFold / ESMFold:直接预测结构,覆盖全蛋白组,但不提供丰度、修饰或相互作用信息,也依赖训练集覆盖度。

10.5 一张对照表

方法 一次测多少 定量能力 是否需要抗体/适配体 典型场景
LC-MS/MS(DDA / DIA) 数千到上万蛋白 中—高 否 发现型研究、修饰组学
TMT / iTRAQ 同一批 10–18 个样本 高(多重) 否 大队列、临床样本
PRM / MRM 几十到几百个目标肽段 很高 否 靶向验证
Olink / SomaScan 一千到七千个蛋白 高 是 血浆大队列生物标志物
RPPA 数百个蛋白/位点 中 是 通路与磷酸化
ELISA / Luminex 1 到几十个 很高 是 临床检测
Western blot 1 到几个 低—中 是 验证
CyTOF 单细胞、40+ 参数 中 是 免疫分型
CITE-seq 单细胞、蛋白 + mRNA 中 是 多组学单细胞
cryo-EM / NMR 一个复合物 不适用 否 结构解析
AlphaFold 全蛋白组 不适用 否 结构预测

11. 落地:一条可复现的处理链路

把上面的内容串起来,一条务实的流程大致是:

raw/                     厂商原始文件,只读,永不修改
  2026-10-26_run01.raw
converted/               msconvert 转换一次,之后只读这里
  2026-10-26_run01.mzML
search/                  搜库输出
  run01.mzid
quant/                   定量矩阵
  report.parquet
figures/                 图表

建议的做法:

  1. 原始文件只读,所有转换产物单独目录,转换参数写进脚本或 README;
  2. 保留 mzML,不要只留 MGF——后面要复查 MS1、同位素或电荷时会用到;
  3. 先用质控指标筛运行:TIC 形状、前体质量误差(ppm)、漏切比例、MS2 数量、iRT 稳定性、carryover;
  4. 记录软件与版本:搜库引擎、FDR 阈值、定量方法、数据库版本(含 isoform 与 contaminant);
  5. 统计分析前先看缺失模式,再决定过滤与填补策略;
  6. 差异分析用能处理缺失与批次的模型:limma + DEqMS / MSstats,而不是简单的 t 检验。

12. 术语表

术语 含义
PSM peptide-spectrum match,一张谱图与一条肽段的匹配
FDR false discovery rate,假发现率
precursor 被选中的母离子(肽段离子)
fragment ion 碎裂后产生的离子,主要是 b / y 系列
TIC / BPC 总离子流 / 基峰色谱
centroid / profile 峰顶取单值 / 保留完整峰形
CCS / 1/K0 碰撞截面积 / 离子淌度
LFQ label-free quantification
TMT / iTRAQ 同重同位素标记试剂
SILAC 细胞培养稳定同位素标记
DDA / DIA / PRM 数据依赖 / 数据独立 / 平行反应监测
MNAR missing not at random,缺失与数值本身相关
mzML HUPO-PSI 维护的开放质谱数据格式

13. 参考